

Dividends Look Simple Until You Actually Build a Portfolio
Dividends Look Simple Until You Actually Build a Portfolio A company pays a dividend. You receive the cash. Reinvest it,
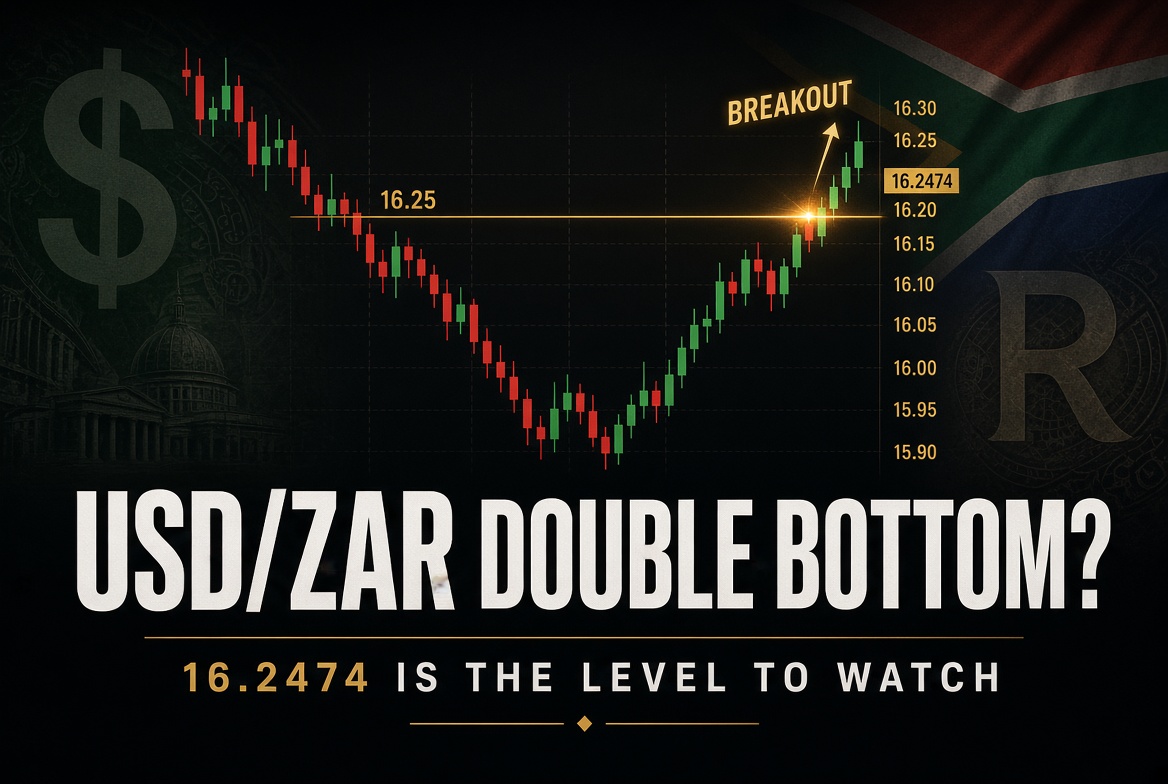
USD/ZAR Double Bottom: Is a Major Reversal Forming?
USD/ZAR Double Bottom: Is a Major Reversal Forming? Last updated: 7 September 2026 The USD/ZAR exchange rate is showing the

Nvidia Posts Longest Losing Streak Since 2022: 7 Days of Declines Ahead of Earnings
Nvidia (NVDA) Posts Longest Losing Streak Since 2022: 7 Days of Declines Nvidia stock has fallen for seven consecutive trading

USD/ZAR Could Retest 16.25 Before Another Move Lower
USD/ZAR Forecast: Could the Rand Strengthen Towards 15.73? The USD/ZAR exchange rate is back near the 16.00 area after falling
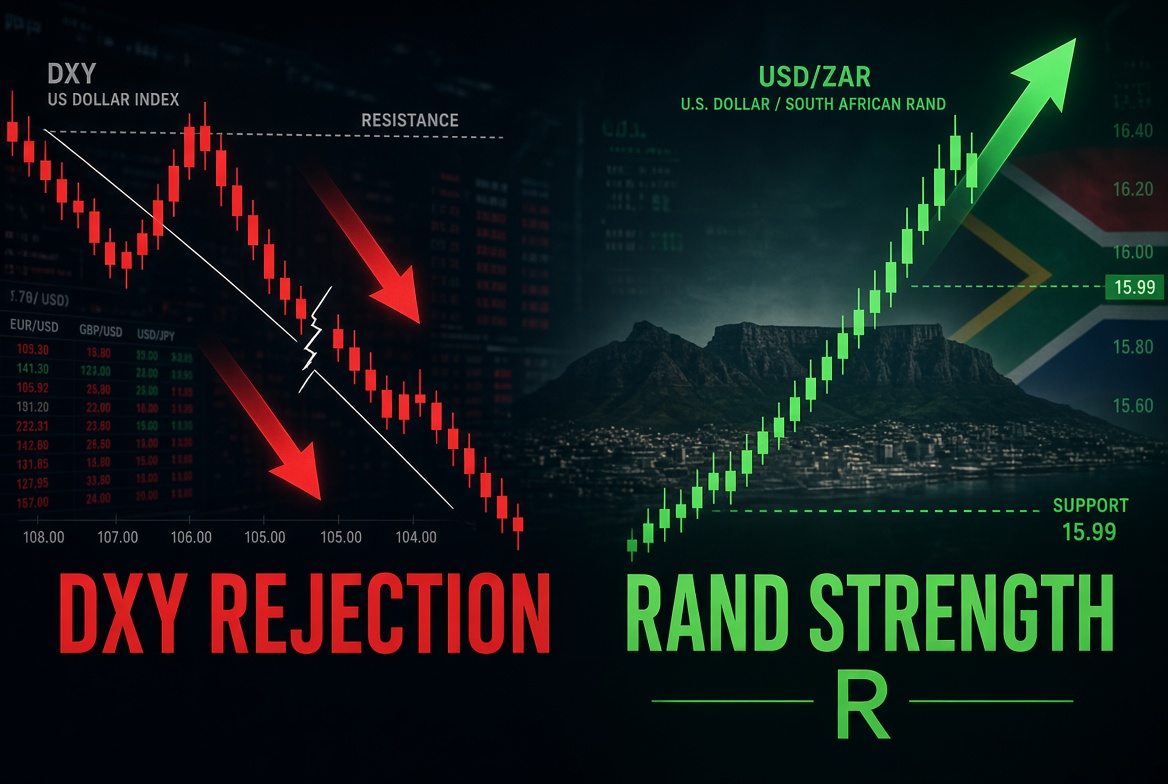
Dollar Weakness Fuels Rand Rally: DXY Support Fails to Hold
DXY Rejection Fuels Rand Strength: USD/ZAR Eyes 15.99 Support Date: August 2026 In the world of forex, the DXY (U.S. Dollar Index) is

Best Islamic Trading Brokers in South Africa: AvaTrade, XM, Tickmill & More [
Islamic (Swap-Free) Trading Account Guide for South Africa (2026) Discover the best Islamic (swap-free) trading accounts in South Africa. Compare

Trading Indicators for Scalping: The Essential Toolkit for Fast-Paced Profits
Trading Indicators for Scalping: The Essential Toolkit for Fast-Paced Profits Trading Indicators for Scalping Discover the best trading indicators for
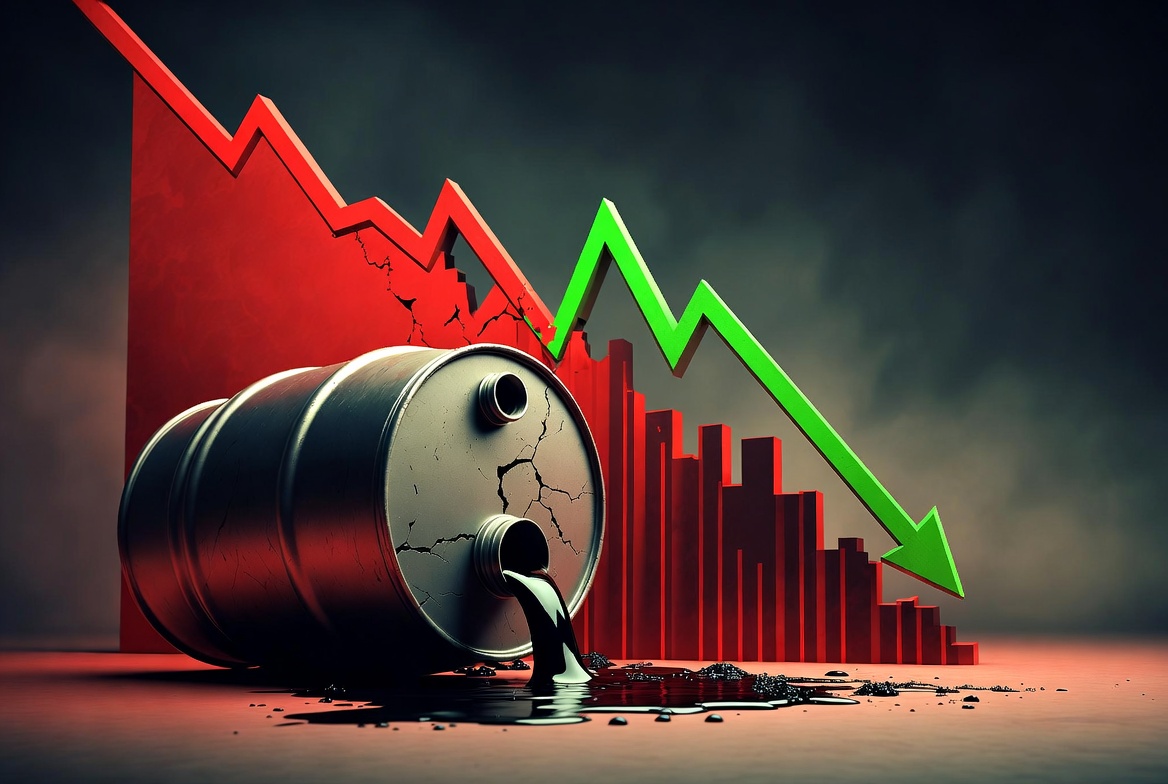
Crude Oil Trade Update: Bearish Setup Triggered but Hits Stop Loss After Strong Bullish Reversal
Crude Oil Trade Update: Bearish Setup Triggered but Hits Stop Loss After Strong Bullish Reversal Crude Oil Trade Update: Bearish
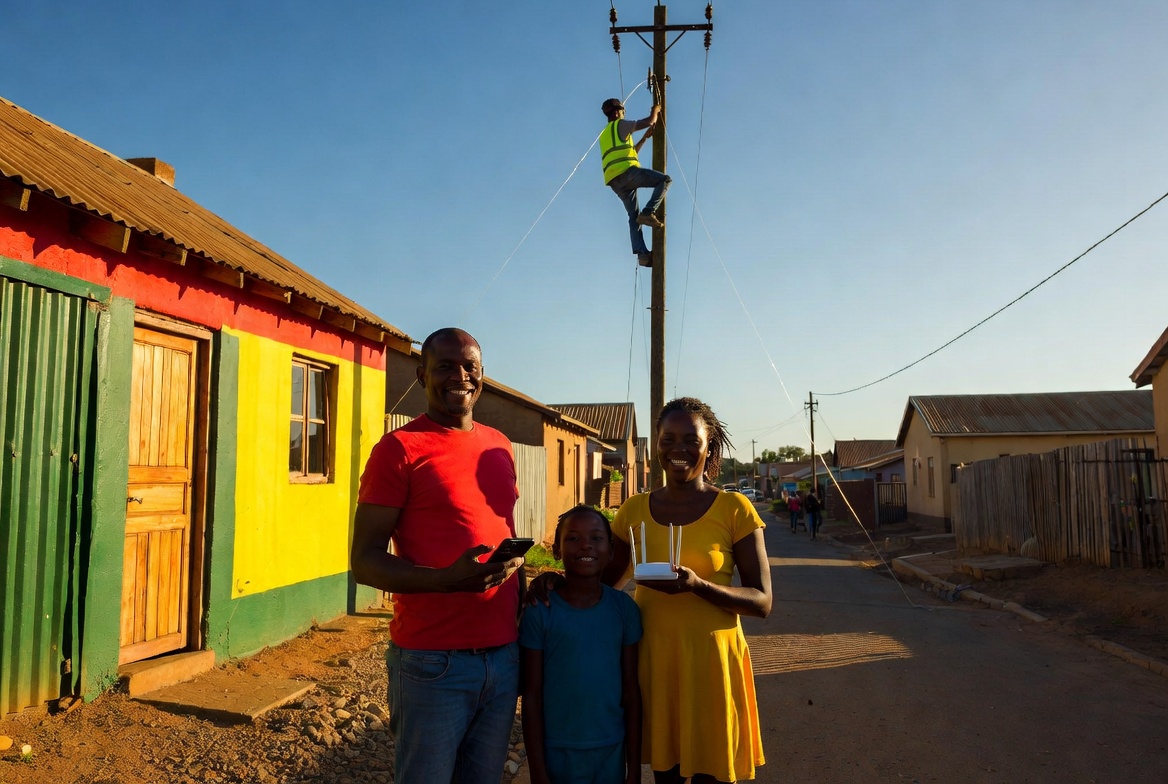
Vuma Reach Fibre in Galeshewe, Kimberley
Vuma Reach Fibre in Galeshewe, Kimberley: Is Your Home Ready for Blazing Fast Internet? Vuma Reach Fibre in Galeshewe, Kimberley
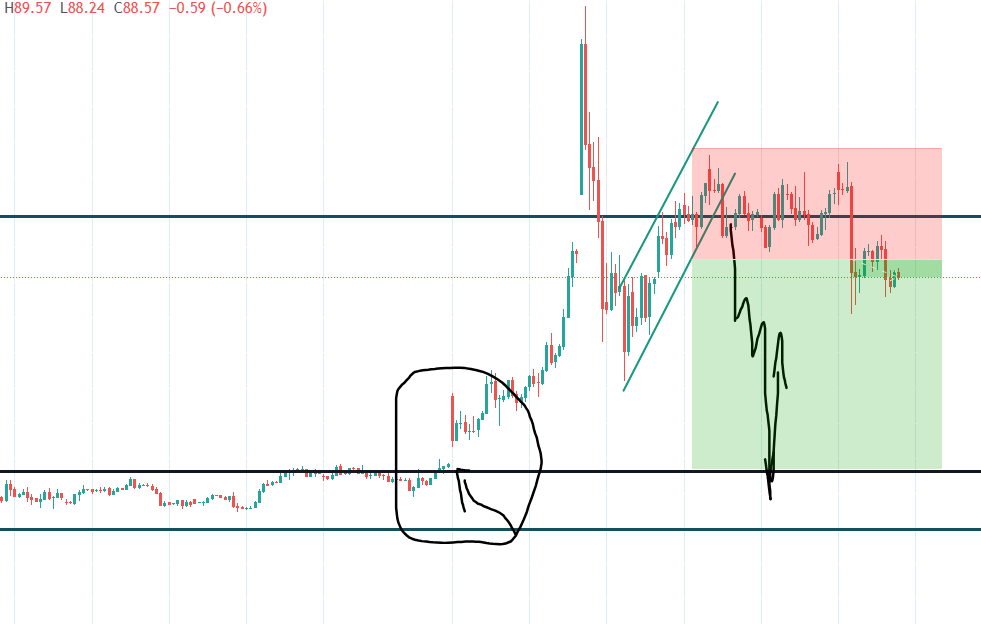
Crude Oil Trade Update: Bearish Setup Triggered and Moving Into Profit
Crude Oil Trade Update: Bearish Setup Triggered and Moving Into Profit Crude Oil Trade Update: Bearish Setup Triggered and Moving

What Is TradingView? A Complete Guide for Traders and Investors
What Is TradingView? A Complete Guide for Traders and Investors What Is TradingView? Complete Guide What Is TradingView? Complete Guide:
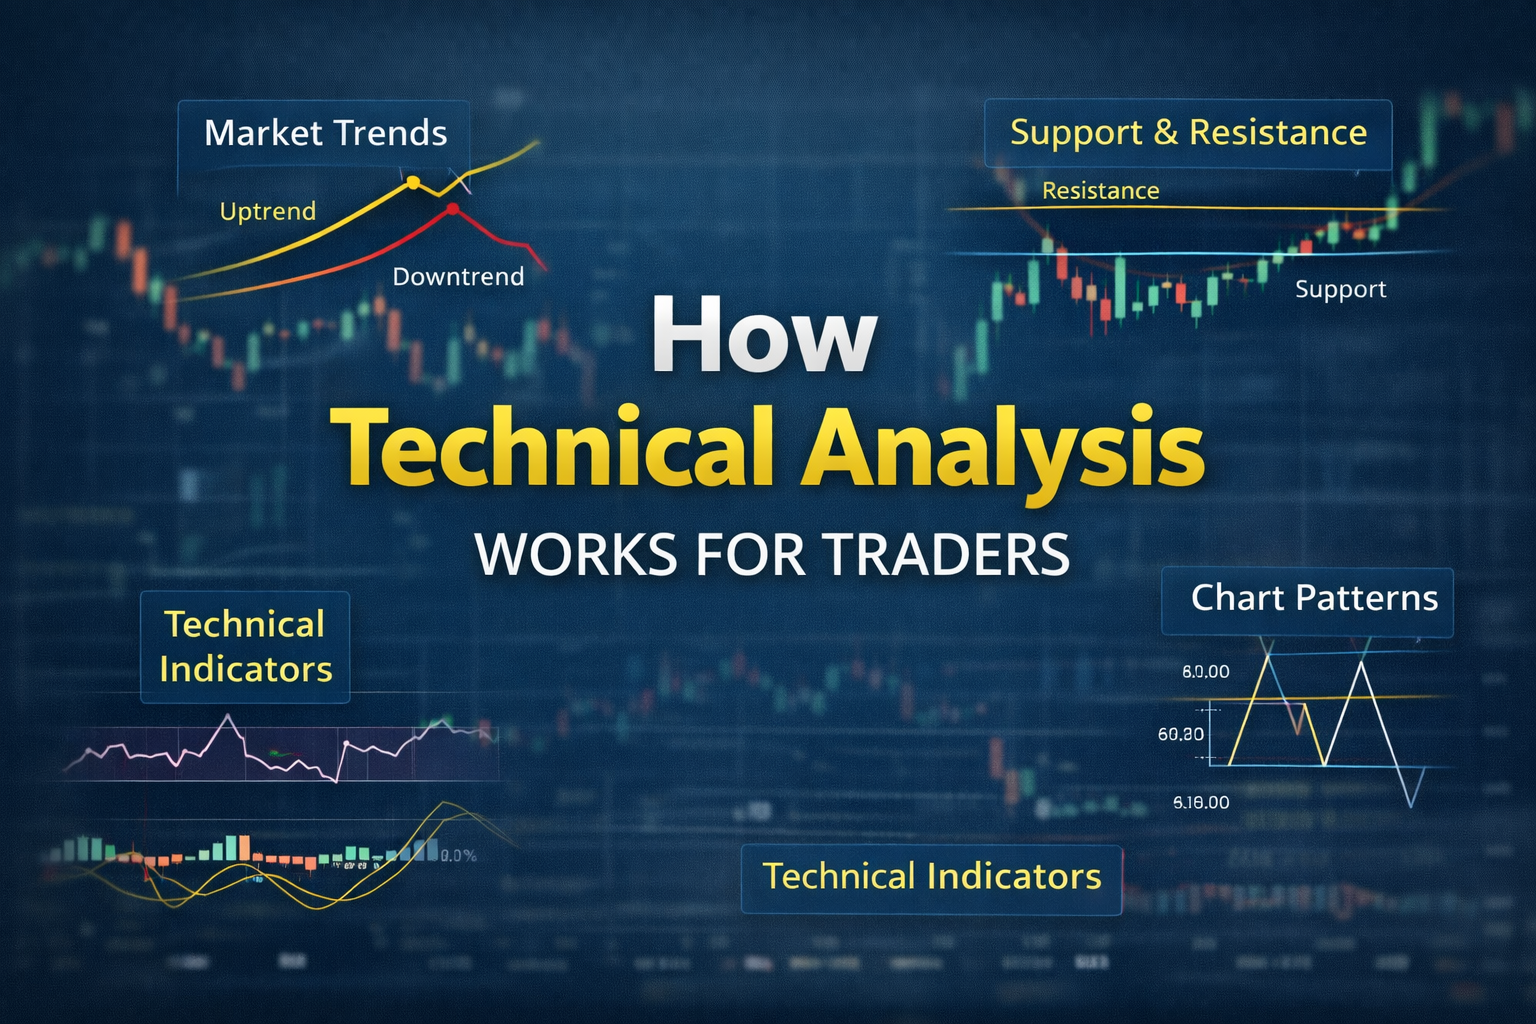
How Technical Analysis Works for Traders
How Technical Analysis Works for Traders How Technical Analysis Works for Traders Technical analysis is a method traders use to

The Most Important Trading Indicators and How to Use Them on Your Charts
Indicators are one of the most misused tools in trading. Most new traders add five or six to their charts,
Technical Analysis for Traders

Technical Analysis for Traders
Price moves in patterns. Technical analysis gives you the tools to read those patterns and make informed trading decisions based on what the chart is telling you.
This section covers technical analysis from the ground up, starting with the basics and building toward more advanced application.
Topics covered in this section include:
- Technical analysis basics. Learn where it comes from, how it works, and why traders rely on it across every market.
- Trading indicators. Understand how indicators like moving averages, RSI, MACD, and Bollinger Bands work and how to apply them to your charts.
- Types of charts. From line charts to bar charts and Heikin Ashi, learn how each one displays price data differently and when to use each.
- Japanese candlestick analysis. Discover the most widely used and some lesser known candlestick patterns and how to build strategies around them.
- Drawing tools. Learn how to correctly apply support and resistance levels, trendlines, channels, and other drawing tools to anticipate price moves.
Technical analysis works across all asset classes. Whether you trade Forex, stocks, commodities, or crypto, the principles in this section apply directly to your charts.
Start with the fundamentals and work through each topic in order. Each one builds on the last.