

Nvidia (NVDA) Posts Longest Losing Streak Since 2022: 7 Days of Declines
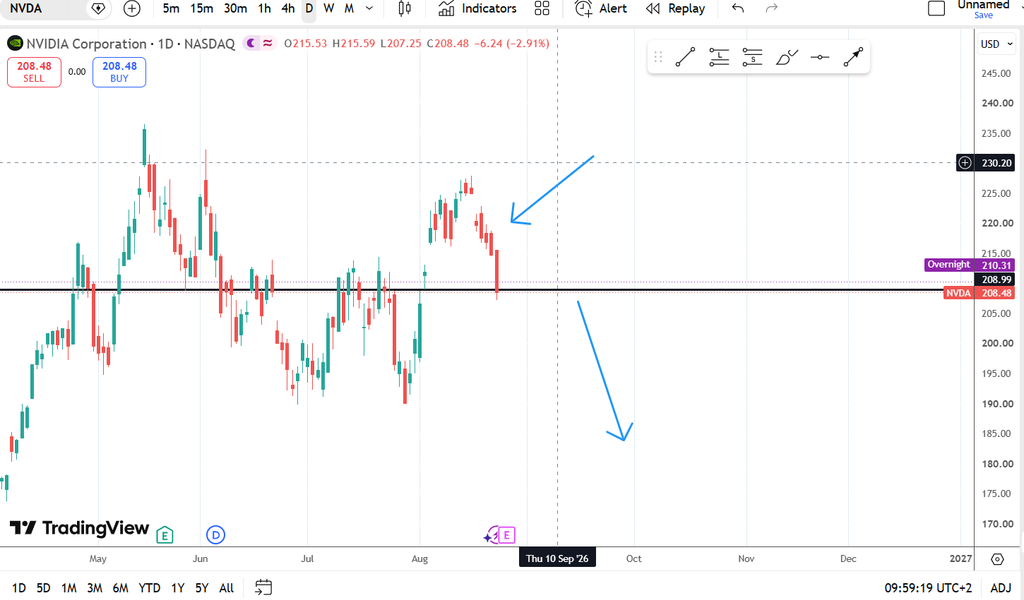
Nvidia stock has fallen for seven consecutive trading days, marking its longest losing streak since 2022. The AI chip giant is set to report earnings on Wednesday amid market caution.
Reading Time: 5 minutes
A Rare Losing Streak for the AI Giant
Nvidia (NVDA) has officially posted its longest losing streak since 2022, falling for the seventh consecutive trading day . The stock is down approximately 6.3% over this stretch, wiping out billions in market value .
The last time Nvidia experienced a longer losing streak was in September 2022, when it fell for seven straight trading days . The current slide comes just ahead of the company’s highly anticipated earnings report on Wednesday .
Key Metrics at a Glance
Why the Stock Is Falling: Key Factors
1. Weakening Relative Performance
Nvidia is now the weakest performer among all Philadelphia Semiconductor Index components in 2025, with a year-to-date gain of only about 7% . This reflects a growing market sentiment that AI chip spending is becoming more broadly distributed across a wider range of semiconductor companies.
2. Valuation Compression
Nvidia‘s forward price-to-earnings (P/E) ratio has dropped to roughly 18x — a multi-year low . However, this low P/E comes with a caveat. According to Nvidia’s latest 10-Q filing, approximately $13.4 billion of the company’s $58 billion in net income came from unrealized gains on publicly traded equity holdings. Excluding this component, the P/E ratio based on normalized net income rises to nearly 60x .
3. Customer Concentration Concerns
Nvidia’s top three customers collectively account for 54% of total revenue . This high concentration raises questions about the sustainability of earnings if any major customer reduces spending.
4. Data Center Growth Slowing
While Nvidia’s data center segment remains dominant, it has shown signs of moderation. The data center business saw its first month-on-month decline since disclosure reports began, though the 1% drop was partially offset by growth in the networking business .
5. China Uncertainty
Nvidia had no H20 sales to China-based customers in Q2, and the Q3 guidance explicitly excludes any H20 shipments to China . The ongoing geopolitical tensions continue to cloud the company’s long-term revenue outlook.
What to Watch on Wednesday: Earnings Preview
Expectations for Q2
| Metric | Estimate |
|---|---|
| Revenue | ~$46.02 billion |
| Adjusted EPS | ~$1.01 |
| Data Center Revenue | ~$41.1 billion |
| Gaming Revenue | ~$4.3 billion |
Key Themes to Watch
Blackwell Ultra Ramp-up: CEO Jensen Huang has described Blackwell as the “AI platform the world has been waiting for,” with production ramping at full speed . Any updates on the Blackwell Ultra (B300) series will be critical.
Share Buybacks: Nvidia authorized an additional $60 billion share buyback program in Q2 . Investors will watch for the pace of buybacks and whether management views the current sell-off as a buying opportunity.
Margin Outlook: Nvidia expects Q3 non-GAAP gross margins of 73.5% , plus or minus 50 basis points, with an exit target in the mid-70% range .
Analyst Reactions: Bullish Despite the Slump
Wall Street remains overwhelmingly bullish on Nvidia :
- 82 analysts cover the stock
- Only 3 hold ratings and 1 sell rating
- Average price target implies more than 50% upside from current levels
Despite the stock’s weakness, profit estimates for Nvidia have been revised upward by a cumulative 13% over the past three months . This divergence between the stock’s performance and earnings expectations is the most significant signal in the current pullback .
Frequently Asked Questions
Why is Nvidia stock falling?
Nvidia has fallen for seven consecutive days due to a combination of factors: weakening relative performance among semiconductor stocks, valuation compression, customer concentration concerns, slowing data center growth, and ongoing China uncertainty .
Is Nvidia’s current P/E ratio attractive?
The forward P/E of 18x appears attractive, but normalized earnings (excluding unrealized gains on equity holdings) suggest a P/E closer to 60x . Investors should look beyond the headline number.
What are analysts saying about Nvidia?
Wall Street analysts remain bullish, with 82 covering the stock and only 4 having hold or sell ratings. The average price target implies more than 50% upside from current levels .
What is Nvidia’s longest losing streak?
Nvidia’s longest losing streak since the current slide was September 2022, when it fell for seven straight trading days . The current streak ties that record.
What is the key risk for Nvidia?
Customer concentration is a significant risk — the top three customers account for 54% of revenue . Any pullback in spending from these customers could materially impact results.
Final Word
Nvidia’s seven-day losing streak marks its longest slump since 2022, wiping out over $277 billion in market value . The stock’s decline reflects growing market caution about AI chip spending, customer concentration, and geopolitical risks.
However, Wall Street analysts remain bullish, and the company’s fundamentals remain strong, with data center revenue growth, a massive buyback program, and the ramp-up of Blackwell Ultra production . Wednesday’s earnings report will be the key test for whether this pullback represents a buying opportunity or the start of a deeper correction.
Key takeaways:
- Nvidia posts 7-day losing streak, longest since September 2022
- $277.7 billion wiped out in market cap
- Forward P/E at 18x (multi-year low)
- Top 3 customers account for 54% of revenue
- Analysts still bullish: average target implies 50%+ upside
- Earnings on Wednesday — key test for the stock
Disclaimer: This article is for informational purposes only and does not constitute financial advice. Stock market investing involves significant risk. Always conduct your own research or consult a licensed financial advisor before making investment decisions.

