
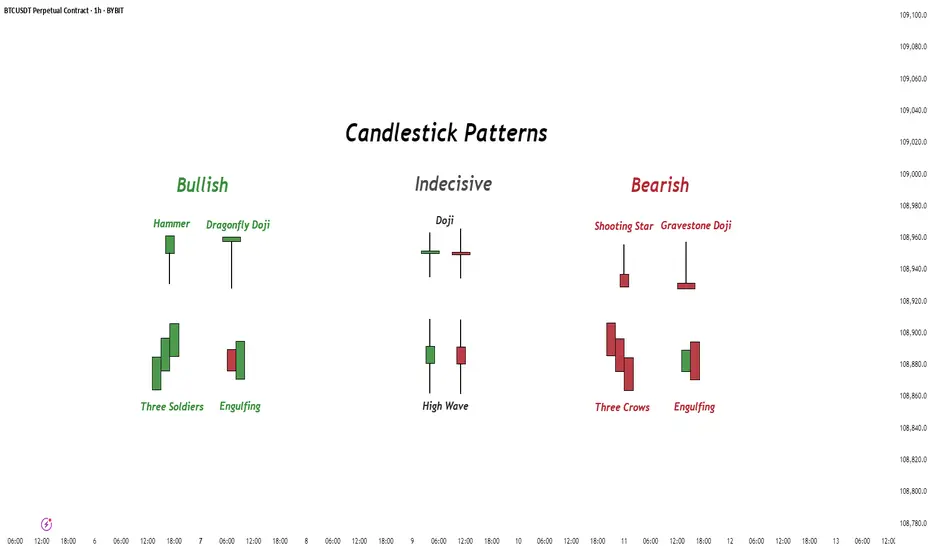
How to Read Candlestick Charts Like a Pro: The Complete Guide
How to Read Candlestick Charts Like a Pro
Learn how to read candlestick charts like a pro. Understand single, double, and triple candlestick patterns, spot trend reversals, and identify high-probability trading setups.
Introduction: The Language of Price Action
Imagine being able to look at a chart and instantly understand the battle between buyers and sellers. That is the power of candlestick charts . Originating in Japan over 200 years ago to track rice prices, candlesticks have become the go-to charting method for traders worldwide . They offer a visual shorthand for market psychology and are the foundation of price action trading . This guide breaks down everything you need to know to read candlestick charts with confidence, covering the essentials from single candles to complex patterns and professional tips.
Part 1: The Anatomy of a Candlestick
Every candlestick tells a story. It captures a specific period—one minute, one day, one week—and displays four key pieces of information known as the OHLC data: the Opening, High, Low, and Close prices .
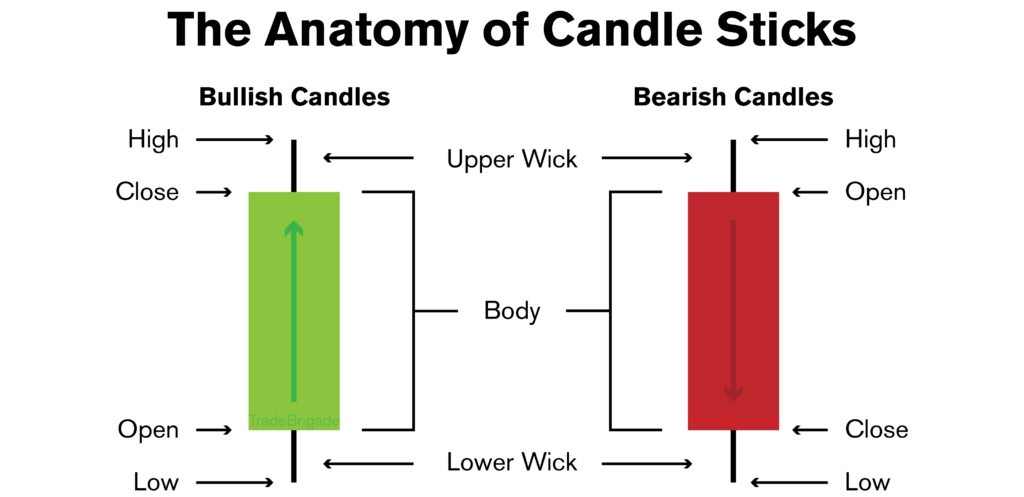
Here are the three parts of a candle:
- The Body: The thick part of the candle. It shows the range between the opening and closing prices .
- Bullish (Green/White) Body: The closing price was higher than the opening price. Buyers were in control .
- Bearish (Red/Black) Body: The closing price was lower than the opening price. Sellers were in control .
- The Wick (or Shadow): The thin lines extending above and below the body. They show the highest and lowest prices traded during the period .
- Upper Wick: Shows the session high.
- Lower Wick: Shows the session low.
Pro Tip: While modern charts typically use green and red, traditional Japanese charts used white (bullish) and black (bearish). It is also possible to customise your chart’s colour scheme .
Part 2: Basic Candlestick Patterns Everyone Should Know
Individual candles can signal a shift in market sentiment. Here are some of the most reliable single-candle patterns :
Bullish Reversal Patterns
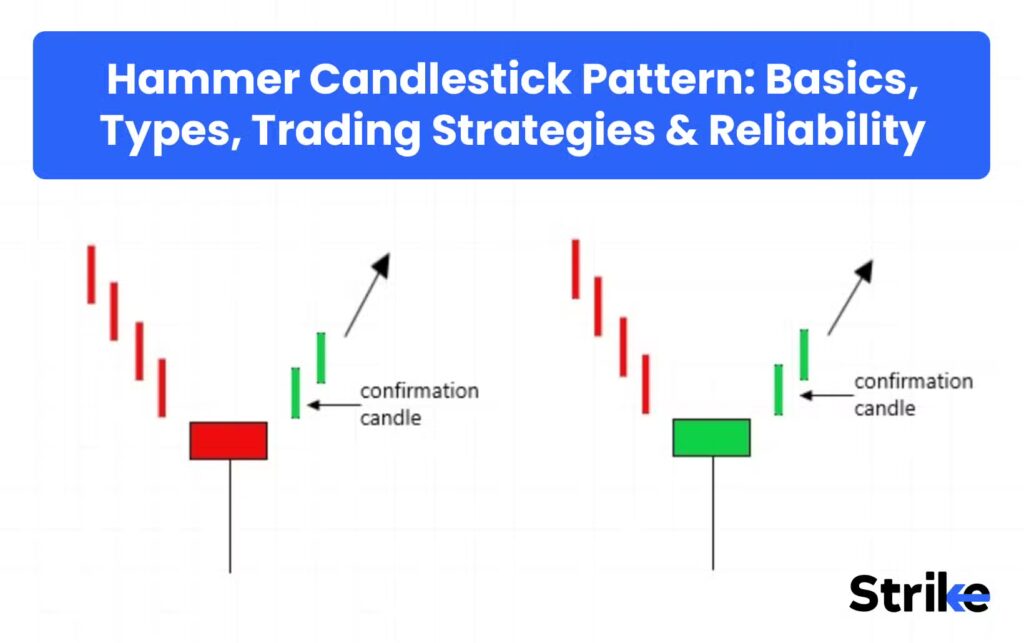
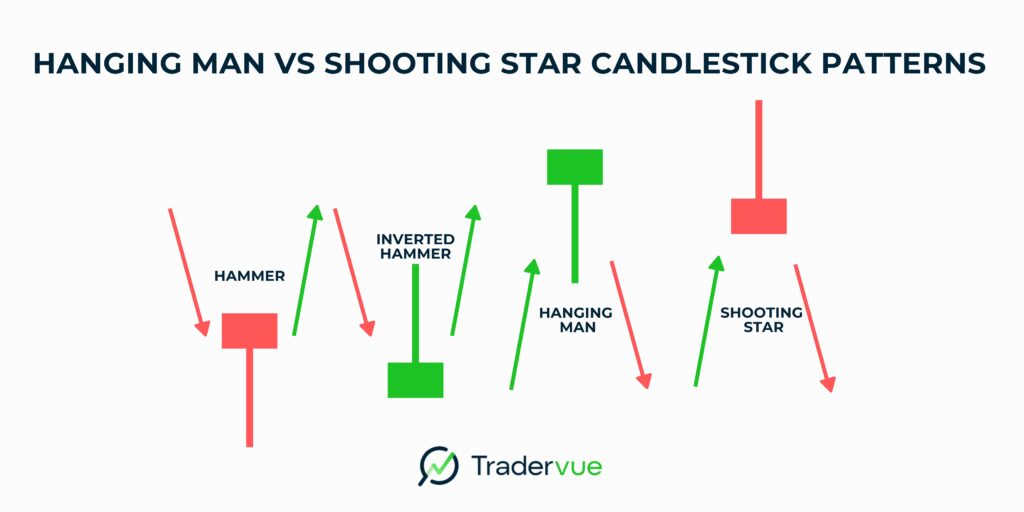
- Hammer: A small body at the top with a long lower wick, appearing in a downtrend. The long lower wick shows sellers pushed prices down, but strong buying pressure stepped in and drove prices back up. It signals a potential bottom .
- Inverted Hammer: A small body at the bottom with a long upper wick, appearing in a downtrend. The long upper wick shows buyers attempted to push prices higher, but sellers temporarily overpowered them. It is a sign that buying pressure is starting to build .
Bearish Reversal Patterns
- Shooting Star: A small body at the bottom with a long upper wick, appearing in an uptrend. The long upper wick shows buyers pushed prices to new highs, but sellers aggressively sold off, driving the price back down. It signals a potential top .
- Hanging Man: A small body at the top with a long lower wick, appearing in an uptrend. It has the same shape as a Hammer, but it appears at the top of an uptrend. The long lower wick indicates that selling pressure is increasing and may soon take control .
Neutral Patterns
- Doji: A candle with almost no body, where the opening and closing prices are virtually the same. It represents indecision in the market and suggests a potential reversal is coming .
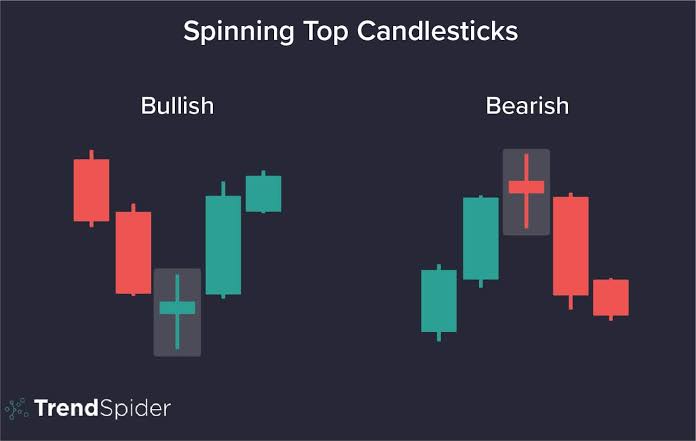
- Spinning Top: A candle with a small body and long upper and lower wicks. It also shows indecision and a struggle between buyers and sellers .

Part 3: Advanced Candlestick Patterns (Double & Triple Candles)
While single candles are informative, patterns formed by multiple candles offer stronger confirmation of a potential move .
Double Candlestick Patterns
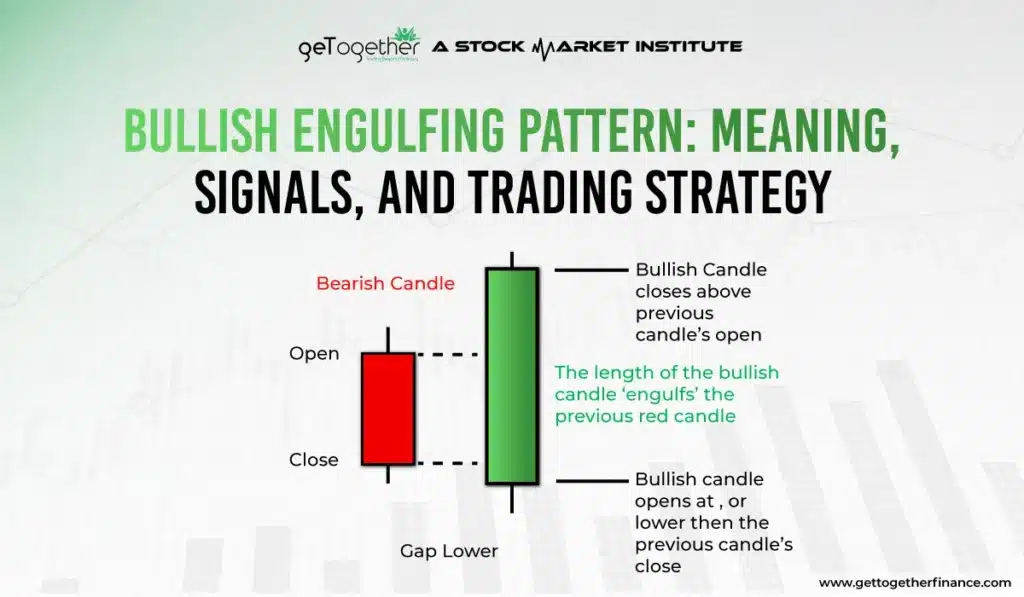
- Bullish Engulfing: A large green candle completely engulfs the body of the previous red candle, appearing in a downtrend. It’s a powerful signal that buyers have overwhelmed sellers and a reversal is underway .
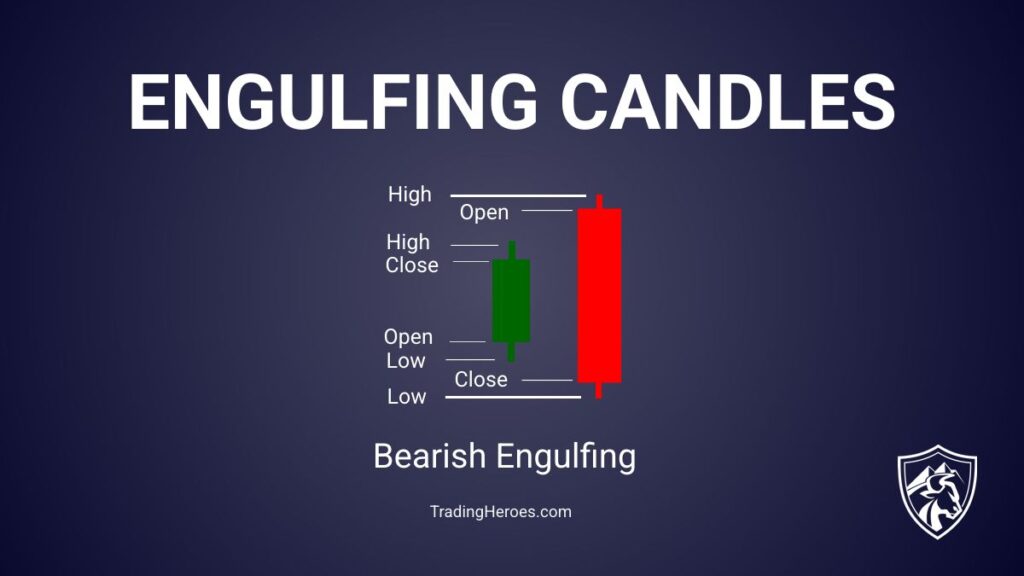
- Bearish Engulfing: A large red candle completely engulfs the body of the previous green candle, appearing in an uptrend. It indicates sellers have taken control, marking a potential top .
Triple Candlestick Patterns
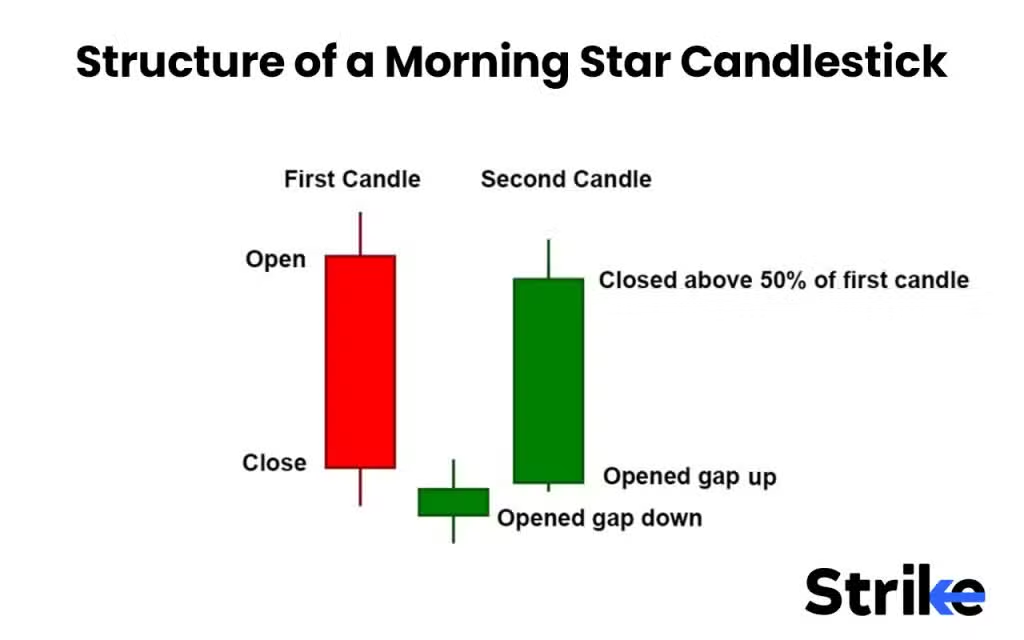
- Morning Star: A three-candle pattern at the end of a downtrend. It consists of a long red candle, followed by a small-bodied candle (like a Doji), and then a long green candle. This pattern powerfully signals a bullish reversal .
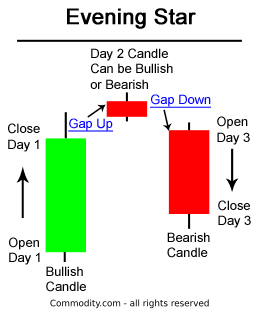
- Evening Star: A three-candle pattern at the end of an uptrend. It consists of a long green candle, followed by a small-bodied candle, and then a long red candle. It is a powerful signal of a bearish reversal .
Part 4: Putting It All Together: Trading Like a Pro
As a pro, the biggest lesson is that a candlestick pattern alone is rarely enough. You need to use it as part of a larger, more robust trading system . Candlestick analysis is the most powerful when you combine it with:
- Prior Trend Context: A bullish pattern like a Morning Star has much more significance after a prolonged downtrend .
- Support and Resistance: A pattern that forms at a well-known support or resistance zone carries more weight . A Hammer at support is a much stronger buy signal than one in the middle of nowhere.
- Technical Indicators: Use indicators to confirm your analysis .
- Moving Averages: Candlestick patterns can confirm bounces or breaks at moving averages .
- RSI: A bullish pattern in oversold conditions (RSI below 30) has a higher probability of success .
- Volume: A breakout accompanied by high volume is much more reliable .
- Multiple Timeframes: Look at a higher time frame to define the primary trend, then use a lower time frame to find precise entry points .
- Confirmation: Wait for the next candle to confirm the pattern before entering a trade. For example, after a Bullish Engulfing pattern, you might wait for the following candle to close higher before entering a long position .
The “Heikin-Ashi” Alternative
For a smoother chart that filters out short-term market noise, consider using Heikin-Ashi candles. They are calculated differently to show the dominant trend, making it easier to stay in a winning trade without being shaken out by volatility .
Frequently Asked Questions
What is the best timeframe for using candlestick patterns?
It depends on your trading style. Scalpers use 1-minute charts, day traders may use 5 to 15-minute charts, and swing traders prefer daily or weekly charts. Higher timeframes generally provide more reliable signals as they incorporate more data and volume .
Can candlestick patterns guarantee a profitable trade?
No. Candlestick patterns are not a guarantee. They are probabilistic signals that indicate a higher likelihood of a particular move. It’s essential to use a stop-loss and manage your risk .
How many candlestick patterns should a beginner learn?
Start with the basics: Hammer, Shooting Star, Doji, Engulfing, and Morning/Evening Star. Mastering these five will give you a solid foundation for understanding market sentiment .
What is the difference between an Engulfing and a Harami pattern?
An Engulfing pattern is a reversal signal where the second candle’s body completely covers the first candle’s body. A Harami pattern is a small candle (a Doji or a Spinning Top) that fits inside the previous candle’s body. It signals indecision but is generally considered a weaker signal .
Disclaimer: This article is for educational purposes only and does not constitute financial advice. Trading involves risk, including the potential loss of capital. Always consult a licensed financial advisor before making investment decisions.

