
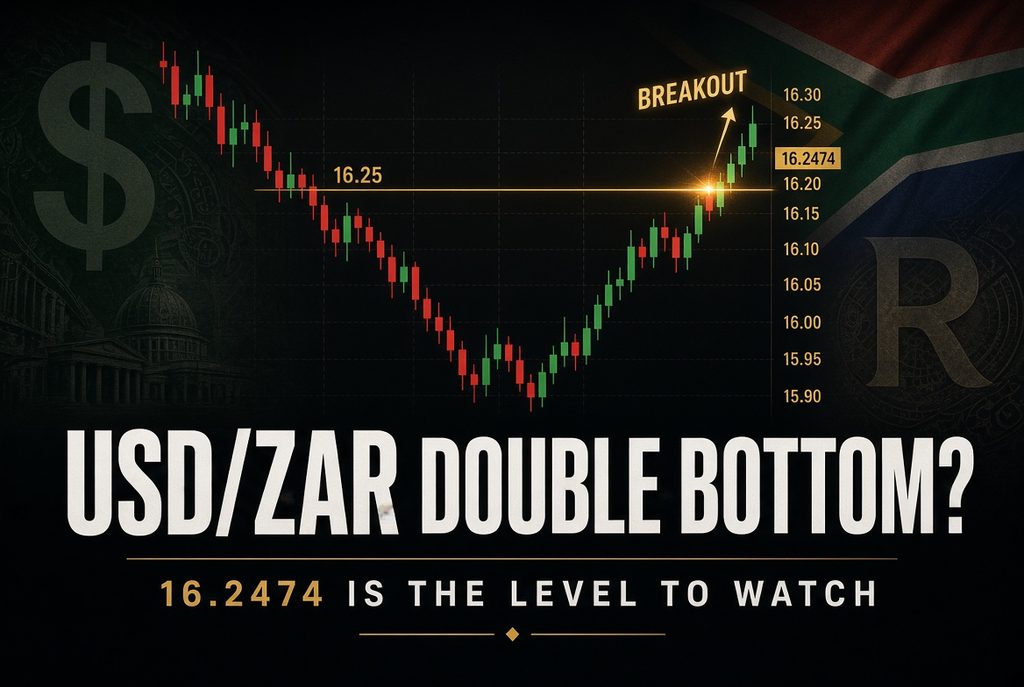
USD/ZAR Double Bottom: Is a Major Reversal Forming?
Last updated: 7 September 2026
The USD/ZAR exchange rate is showing the early stages of a potentially important technical reversal, with the 4-hour chart developing a W-shaped double-bottom pattern.
But there is a catch.
The reversal has not been confirmed yet.
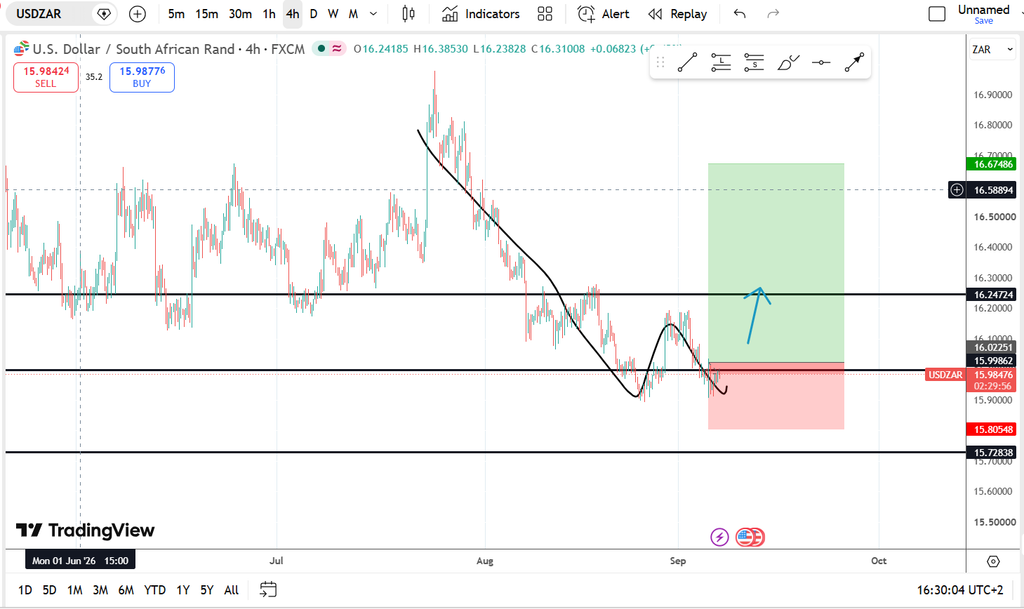
USD/ZAR is currently trading around the 15.98–16.00 area, while the most important technical level sits considerably higher at 16.2474.
That level represents the neckline of the potential double bottom.
A decisive 4-hour close above 16.2474 would significantly strengthen the bullish reversal case. Failure to break the neckline, followed by a move back below the recent lows, would leave the pattern vulnerable to failure.
For traders watching the US dollar against the South African rand, the next few price moves could therefore be particularly important.
Is USD/ZAR forming a double bottom?
Potentially, yes.
The USD/ZAR 4-hour chart currently resembles the early stages of a classic double-bottom reversal, with price creating two significant lows separated by a recovery.
The structure can be simplified as:
First low → rebound → second low → neckline test
The two lows are developing around the 15.90–15.95 region, while the recovery between them creates the resistance area that eventually becomes the neckline.
That neckline is approximately 16.2474.
This distinction is important.
A double bottom is not confirmed simply because price creates two lows.
The market still needs to break the resistance separating those lows.
Therefore, the current setup should be described as a potential double bottom, rather than a confirmed reversal.
The USD/ZAR level that matters most: 16.2474
If there is one level USD/ZAR traders should have on their radar, it is 16.2474.
This is the neckline of the potential W pattern.
A strong move through the neckline would indicate that buyers have managed to overcome the resistance created during the first recovery.
More importantly, a 4-hour candle close above 16.2474 would provide considerably stronger confirmation than a temporary intraday move above the level.
The ideal bullish scenario would therefore be:
USD/ZAR breaks 16.2474 → closes above it → retests the area → finds support → continues higher.
That would transform the current setup from an anticipation trade into a much more clearly confirmed technical reversal.
USD/ZAR technical analysis: the structure so far
The broader structure is also worth watching.
USD/ZAR had previously been trading within a declining structure, with the descending trendline helping define the bearish move.
The subsequent break above that trendline is an early indication that the previous selling pressure may be weakening.
On its own, however, a trendline break is not enough to confirm a trend reversal.
This is where the potential double bottom becomes interesting.
The market is effectively attempting to establish:
A higher low → a break of resistance → a new bullish structure.
That is why the price action around 15.90–16.25 is arguably more important than any single candle.
USD/ZAR key support and resistance levels
| Level | Technical significance |
|---|---|
| 15.80–15.85 | Major bearish invalidation area |
| 15.90–15.95 | Double-bottom support zone |
| 15.98–16.00 | Current decision area |
| 16.02 | Initial resistance |
| 16.15–16.20 | Intermediate resistance |
| 16.2474 | Double-bottom neckline |
| 16.50–16.60 | Potential bullish target zone |
| 16.67 | Extended upside objective |
These levels are technical reference points based on the chart structure and should not be interpreted as guaranteed future prices.
15.90–15.95: the area bulls need to defend
The 15.90–15.95 region is particularly important because it represents the area around the two lows forming the potential W pattern.
If USD/ZAR continues to find buyers here, the market maintains the basic structure required for the reversal thesis.
A move back toward this area does not automatically invalidate the setup.
In fact, a controlled retest followed by another bullish reaction could strengthen the idea that buyers are gradually taking control.
The problem would come if price moves decisively below the second low.
That would raise the probability that the apparent double bottom was simply a temporary consolidation rather than a genuine reversal pattern.
16.02: the first hurdle
Before USD/ZAR can even challenge the neckline, buyers need to regain control of the 16.02 area.
A move above this level would be an early positive signal, but it would still leave the larger resistance at 16.2474 intact.
This means traders should avoid treating a move through 16.02 as confirmation of the entire pattern.
The market still has work to do.
16.2474: confirmation level
This is the level that could change the entire technical picture.
A sustained break above 16.2474 would complete the basic double-bottom structure.
For confirmation, traders could look for:
- A strong 4-hour breakout
- A candle close above the neckline
- Follow-through buying
- A successful retest of the breakout area
- Continued higher highs and higher lows
The strongest version of the setup would therefore look like:
Break → close → retest → continuation.
A simple wick above 16.2474 would provide much weaker evidence.
Where could USD/ZAR go after a confirmed breakout?
If USD/ZAR successfully clears the neckline, the next areas to monitor would be approximately 16.50–16.60.
The 16.67 area represents a more ambitious upside objective from the current structure.
The traditional double-bottom methodology uses the vertical distance between the bottom of the formation and its neckline to estimate a potential measured move.
That approach suggests the bullish pattern has enough depth to justify looking substantially above the neckline if the breakout is confirmed.
However, price does not necessarily travel directly to the measured target.
Resistance can appear along the way.
For that reason, 16.50–16.60 should be treated as an important intermediate zone before 16.67 becomes the focus.
The bullish USD/ZAR scenario
The bullish case can be broken down into a simple sequence.
Stage 1: Support holds
USD/ZAR remains above approximately 15.90–15.95.
Stage 2: Buyers regain 16.02
Price pushes through the first important resistance.
Stage 3: Momentum builds
USD/ZAR moves toward 16.15–16.20.
Stage 4: Neckline breaks
Price decisively clears 16.2474.
Stage 5: Breakout is confirmed
A 4-hour candle closes above the neckline.
Stage 6: Retest
The previous resistance zone potentially becomes support.
Stage 7: Continuation
The market targets approximately:
16.50 → 16.60 → 16.67
This would be the cleanest technical pathway for the reversal.
What could invalidate the USD/ZAR double bottom?
The biggest risk to the bullish setup is a breakdown through the second low.
The 15.80–15.85 region is therefore an important line in the sand.
If USD/ZAR decisively loses this area, the current bullish thesis becomes significantly weaker.
That would suggest that sellers have regained control and that the apparent W formation failed to produce the expected reversal.
The important distinction is that a small move below support is not necessarily enough on its own.
Traders should distinguish between:
temporary volatility
and
a confirmed structural breakdown.
That is why closing prices and follow-through matter.
USD/ZAR forecast: bullish or bearish?
The short-term technical outlook is cautiously bullish, but confirmation is still required.
The combination of a potential double bottom and the earlier break from the declining structure gives the bulls a credible setup.
However, the market has not yet broken the most important resistance.
That means calling for a confirmed USD/ZAR bullish reversal at the current price would be premature.
The technical picture can currently be summarized as:
Below 16.2474: potential reversal.
Above 16.2474: bullish confirmation strengthens.
Above 16.50: upside momentum becomes more significant.
Around 16.60–16.67: major upside objective zone.
Below 15.80: double-bottom thesis is seriously damaged.
What does the USD/ZAR chart need to do next?
The next move is arguably more important than the pattern itself.
For bulls, the ideal sequence is:
Hold 15.90–15.95
↓
Reclaim 16.02
↓
Break 16.15–16.20
↓
Clear 16.2474
↓
Close above the neckline
↓
Retest
↓
Target 16.50–16.60
↓
Potential move toward 16.67
If that sequence develops, the current chart would begin to look considerably more convincing as a medium-term reversal.
If USD/ZAR instead rejects resistance and returns below the recent lows, the market may remain trapped in a broader range.
Frequently asked questions
Is USD/ZAR forming a double bottom?
USD/ZAR is showing the early structure of a potential double-bottom reversal on the 4-hour chart. The pattern is not confirmed until price breaks and closes above the approximately 16.2474 neckline.
What is the key USD/ZAR resistance level?
The key resistance level for the potential reversal is 16.2474. A sustained break above this area would strengthen the bullish case.
What is the USD/ZAR bullish target?
If the neckline breaks successfully, the next technical areas to monitor are approximately 16.50–16.60, followed by the extended 16.67 area.
What level would invalidate the double bottom?
The 15.80–15.85 region is the major technical invalidation area for the bullish setup. A decisive breakdown below it would significantly weaken the double-bottom thesis.
Is this a confirmed USD/ZAR reversal?
No. The reversal is currently a developing setup. Confirmation requires a convincing break and 4-hour close above 16.2474, ideally followed by successful support on a retest.
Bottom line
The USD/ZAR chart is becoming interesting.
The potential W-shaped double bottom, combined with the break from the previous declining structure, gives traders a reason to watch the pair closely.
But the market has not earned the word “reversal” yet.
That confirmation sits at 16.2474.
A decisive 4-hour close above that level could turn the current setup into a much stronger bullish reversal signal, with 16.50–16.60 becoming the next major area to watch and 16.67 representing an extended upside objective.
Until then, the most accurate description is:
USD/ZAR is attempting to build a bullish reversal — but the neckline still needs to break.
For now, 15.90–15.95 is the support zone, 16.02 is the first hurdle, 16.2474 is the confirmation level, and 15.80 is the major bearish invalidation zone.
This article is for informational and educational purposes only and does not constitute financial advice. Forex and CFD trading involve significant risk, and technical patterns can fail.

