
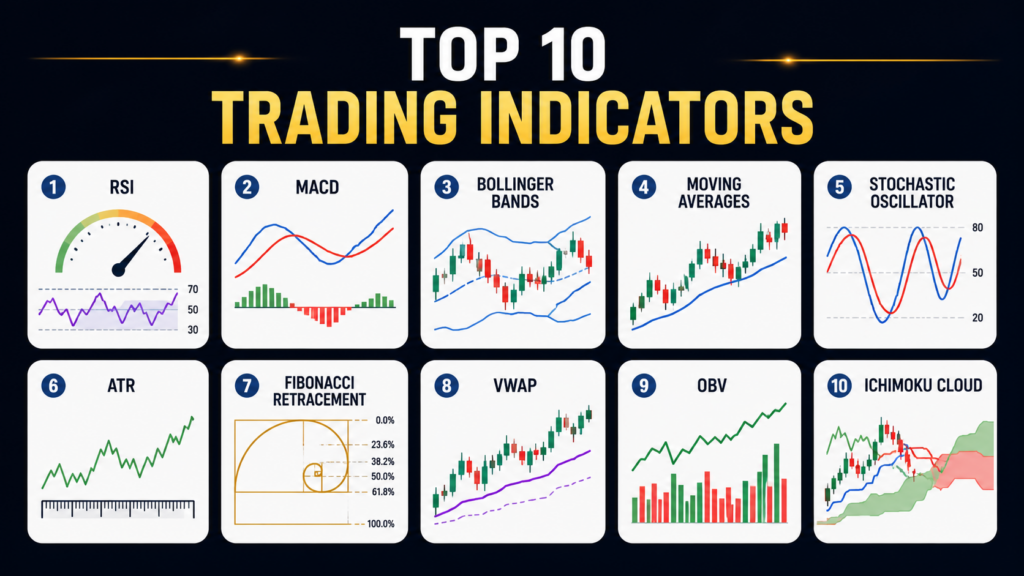
Top 10 Trading Indicators Every Beginner Should Know
Learn the top 10 trading indicators every beginner should know, including RSI, MACD, Bollinger Bands, Moving Averages, and more. Discover how each works and how to use them.
Your Starting Point for Technical Analysis
Trading indicators are mathematical calculations plotted on price charts that help traders interpret market behaviour, identify trends, and make more informed decisions . They transform raw price and volume data into visual signals that can reveal momentum, volatility, or potential reversal points.
For beginners, the sheer number of indicators available can be overwhelming. This guide breaks down the 10 most essential indicators every new trader should understand. We’ll explain what each one does, how to read it, and how to use it effectively.
How Trading Indicators Are Categorised
Before diving into the list, it helps to understand the two main types of indicators :
| Category | What It Does | When to Use |
|---|---|---|
| Leading Indicators | Signal potential future movements before they happen | To anticipate reversals or trend changes |
| Lagging Indicators | Confirm trends after they have begun | To validate existing trends and avoid false signals |
Most beginners should start by learning how to use one trend indicator and one momentum indicator together before adding more to their charts.
The Top 10 Trading Indicators
1. Moving Averages (MA)
A moving average smooths out price data to reveal the underlying trend direction. By averaging prices over a set period, it filters out short-term noise and helps identify whether the market is trending up, down, or sideways .
How to use it:
- Price above the moving average often indicates a bullish trend
- Price below suggests a bearish trend
- Moving averages can act as dynamic support and resistance levels
Two main types:
- Simple Moving Average (SMA): Averages prices over a specific period
- Exponential Moving Average (EMA): Gives more weight to recent prices, making it more responsive to new information
2. Relative Strength Index (RSI)
RSI is a momentum oscillator that measures the speed and magnitude of price changes on a scale from 0 to 100 . It helps traders identify when an asset may be overbought or oversold .
How to read RSI:
- Above 70: Overbought – price may be due for a pullback
- Below 30: Oversold – price may be due for a bounce
- Divergence: When price makes a new high but RSI makes a lower high, it can signal weakening momentum
Example: If Bitcoin’s RSI hits 80 during a price surge, it may suggest the coin is overbought and due for a correction .
3. MACD (Moving Average Convergence Divergence)
MACD is a trend-following momentum indicator that shows the relationship between two moving averages . It helps traders spot shifts in momentum and potential trend reversals .
What MACD shows:
- MACD Line: The difference between a 12-period and 26-period EMA
- Signal Line: A 9-period EMA of the MACD line
- Histogram: The difference between the two lines, showing momentum strength
Key signals:
- Bullish crossover: MACD line crosses above the signal line – potential buy signal
- Bearish crossover: MACD line crosses below the signal line – potential sell signal
4. Bollinger Bands
Bollinger Bands consist of a moving average with upper and lower bands set at standard deviations above and below it . They help traders visualise volatility and identify potential breakout points .
How to read Bollinger Bands:
- Wide bands: High volatility
- Narrow bands (squeeze): Low volatility – often precedes a sharp move
- Price touching the upper band may suggest overbought conditions; touching the lower band may suggest oversold conditions
5. Stochastic Oscillator
The Stochastic Oscillator compares an asset’s closing price to its recent price range . It helps traders identify overbought and oversold conditions, making it useful for timing reversals .
How to read it:
- Above 80: Overbought – potential reversal down
- Below 20: Oversold – potential reversal up
- Crossovers: When the fast line (%K) crosses the slow line (%D), it can signal entry or exit points
6. Average True Range (ATR)
ATR measures market volatility without indicating direction. It shows how much an asset typically moves over a given period, making it invaluable for setting stop-loss levels .
How to use ATR:
- Set stop-losses at a multiple of ATR (e.g., 1.5 × ATR below entry)
- Higher ATR = higher volatility = wider stops needed
- Lower ATR = lower volatility = tighter stops possible
7. Fibonacci Retracement
Fibonacci Retracement identifies potential support and resistance levels based on key ratios derived from the Fibonacci sequence . These levels suggest where price pullbacks might pause before the prevailing trend resumes .
Common retracement levels:
- 23.6%, 38.2%, 50%, 61.8%, 78.6%
These levels can help traders fine-tune entry points, stop-loss orders, and profit targets .
8. VWAP (Volume Weighted Average Price)
VWAP calculates the average price of an asset based on the volume traded at each price level . It is a popular intraday indicator that shows whether price is trading above or below the average institutional entry level .
How to use VWAP:
- Price above VWAP = bullish bias
- Price below VWAP = bearish bias
- Often used by institutional traders as a benchmark for fair value
9. On-Balance Volume (OBV)
OBV measures buying and selling pressure by adding volume on up days and subtracting volume on down days . It helps confirm price trends by showing whether volume supports the current price movement .
How to read OBV:
- Rising OBV + rising price = bullish confirmation
- Falling OBV + falling price = bearish confirmation
- Divergence between OBV and price can signal weakening trends
10. Ichimoku Cloud
The Ichimoku Cloud provides a comprehensive snapshot of trend direction, momentum, and support/resistance levels all in a single view . While visually complex, it offers a multi-dimensional perspective on market structure .
How to read it:
- Price above the cloud = bullish trend
- Price below the cloud = bearish trend
- Green cloud (Leading Span A above Leading Span B) = bullish signal
- Red cloud = bearish signal
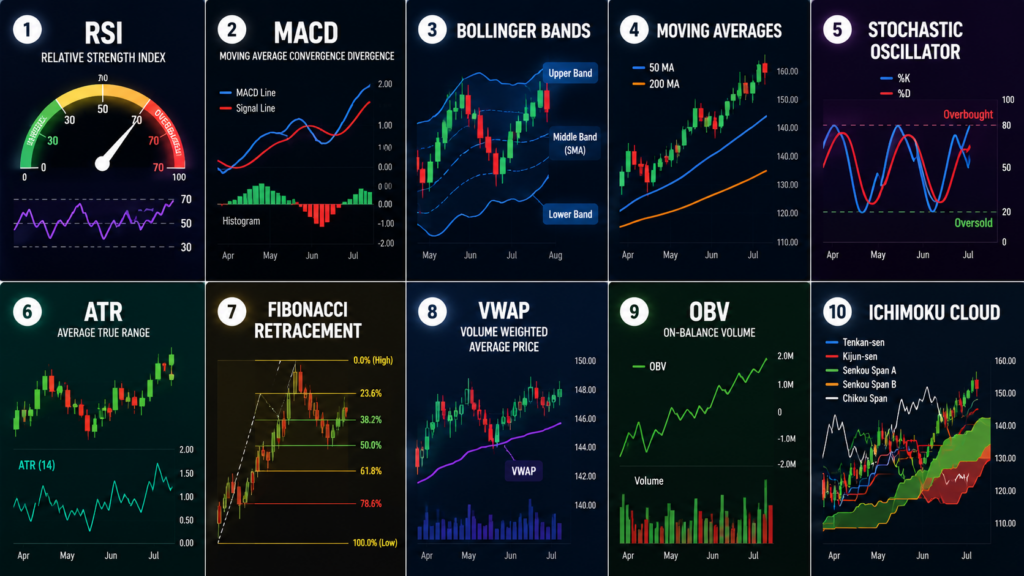
Quick Reference Table
How to Start Using These Indicators
Practical recommendations for beginners:
- Start with 2-3 core indicators – Moving Averages, RSI, and Bollinger Bands are a great starting combination .
- Use a trend filter first – Only take trades that align with the broader trend .
- Add a momentum trigger – Use RSI to confirm entries when the trend filter is satisfied .
- Set stops using ATR – Place stop-loss orders at 1-2 × ATR to manage risk .
Important reminder: Indicators produce false signals, especially during volatile or news-driven market conditions . They are tools, not guarantees.
Frequently Asked Questions
What is the best indicator for beginners?
Moving averages and RSI are excellent starting points. They are easy to understand and provide clear signals .
Can I use all these indicators at once?
No. Using too many indicators leads to conflicting signals. Start with 2-3 complementary tools .
Are indicators more useful for trending or ranging markets?
Trend indicators (like Moving Averages and MACD) work best in trending markets. Oscillators (like RSI and Stochastic) are more useful in ranging markets .
What is the difference between leading and lagging indicators?
Leading indicators (like RSI) attempt to predict future price movements. Lagging indicators (like Moving Averages) confirm trends that have already started .
Do I need to use indicators to trade successfully?
No. Many successful traders use pure price action analysis without indicators. However, indicators can provide structure and reduce emotional decision-making for beginners .
Final Word
Learning to use trading indicators is a journey. The 10 indicators covered in this guide represent the essential toolkit that most traders rely on, whether they are trading forex, stocks, or crypto .
The key is not to master them all at once. Start with one or two, understand how they work, and practice using them on historical charts. As you gain confidence, add more tools to your analysis. And always remember: indicators are there to guide your decisions – not to make them for you.
Disclaimer: This article is for educational purposes only and does not constitute financial advice. Trading carries risk. Always consult a licensed financial advisor before making investment decisions.

