How Technical Analysis Works for Traders
How Technical Analysis Works for Traders
Technical analysis is a method traders use to analyze financial markets by studying price charts, patterns, and indicators. Instead of focusing on economic reports or company financials, technical analysis focuses on historical price movements to predict potential future trends.
Many traders use charting platforms like TradingView and trading platforms such as MetaTrader 4 to perform technical analysis across markets including forex, stocks, cryptocurrencies, and commodities.

Understanding Market Trends
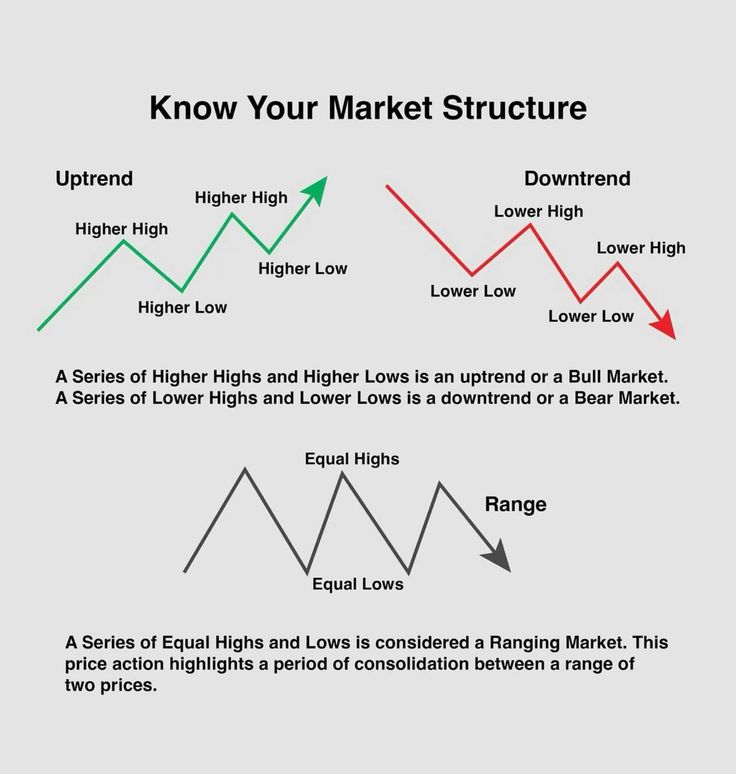
One of the main goals of technical analysis is to identify the direction of the market trend.
There are three common market trends:
- Uptrend – The price moves higher with higher highs and higher lows.
- Downtrend – The price moves lower with lower highs and lower lows.
- Sideways trend – The price moves within a range without a clear direction.
Recognizing the trend helps traders decide whether to buy, sell, or wait.
Support and Resistance Levels
Support and resistance are important price levels where the market tends to pause or reverse.
- Support is a price level where demand may increase and stop the price from falling further.
- Resistance is a price level where selling pressure may prevent the price from rising higher.
Traders use these levels to find potential entry and exit points.

Using Technical Indicators
Indicators help traders analyze market momentum and trend strength.
Popular indicators include:
- Relative Strength Index (RSI) – Shows whether the market is overbought or oversold.
- Moving Averages – Helps identify the direction of the trend.
- MACD (Moving Average Convergence Divergence) – Shows changes in momentum.
- Bollinger Bands – Measures market volatility.
Most of these indicators are available on platforms like TradingView and MetaTrader 4.
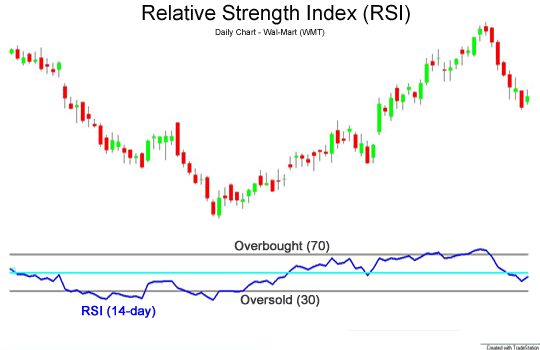

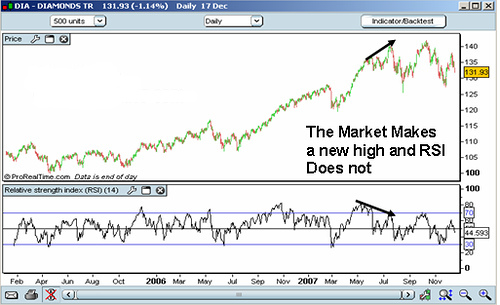
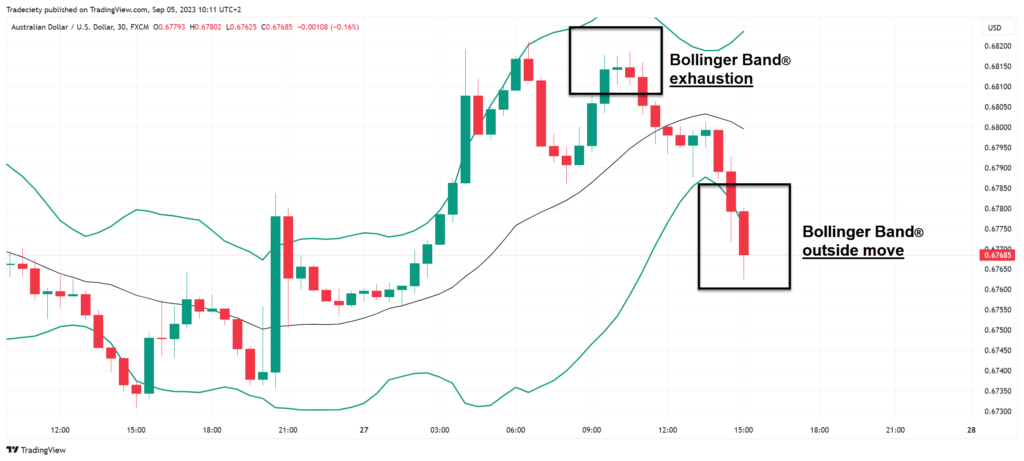
Chart Patterns
Technical traders also look for chart patterns that repeat in the market.
Common patterns include:
- Head and Shoulders
- Double Top and Double Bottom
- Triangles
- Flags and Pennants
These patterns help traders anticipate possible breakouts or trend reversals.

Risk Management
Technical analysis alone is not enough. Successful traders also focus on risk management.
Important risk management tools include:
- Setting stop-loss orders
- Using proper position sizing
- Maintaining a good risk-to-reward ratio
This helps traders protect their capital during volatile market conditions.

Technical analysis helps traders understand market behavior by studying price movements, trends, and indicators. While it does not guarantee profits, it provides traders with tools to make more informed trading decisions.
By combining technical analysis with strong risk management, traders can improve their chances of success in financial markets.