
Trading Indicators for Scalping: The Essential Toolkit for Fast-Paced Profits

Trading Indicators for Scalping
Discover the best trading indicators for scalping including EMA, RSI, Bollinger Bands, VWAP, and MACD. Learn how to combine them for high-probability setups in fast-moving markets.
Why Indicators Matter in Scalping
In high-speed environments like scalping, indicators aren’t just optional—they’re critical tools that provide structure, reduce emotional decision-making, and define repeatable setups. Scalping is an extremely short-term trading style where positions are held for seconds to minutes, with traders executing multiple trades throughout the day to accumulate small gains.
However, not every indicator fits the time-sensitive nature of scalping trading. The best ones are reactive, real-time, and confirm momentum quickly. This guide covers the most effective indicators for scalping, how to use them, and how to combine them for stronger signals.
Why Scalpers Need Indicators
The Best Indicators for Scalping
1. Exponential Moving Average (EMA)
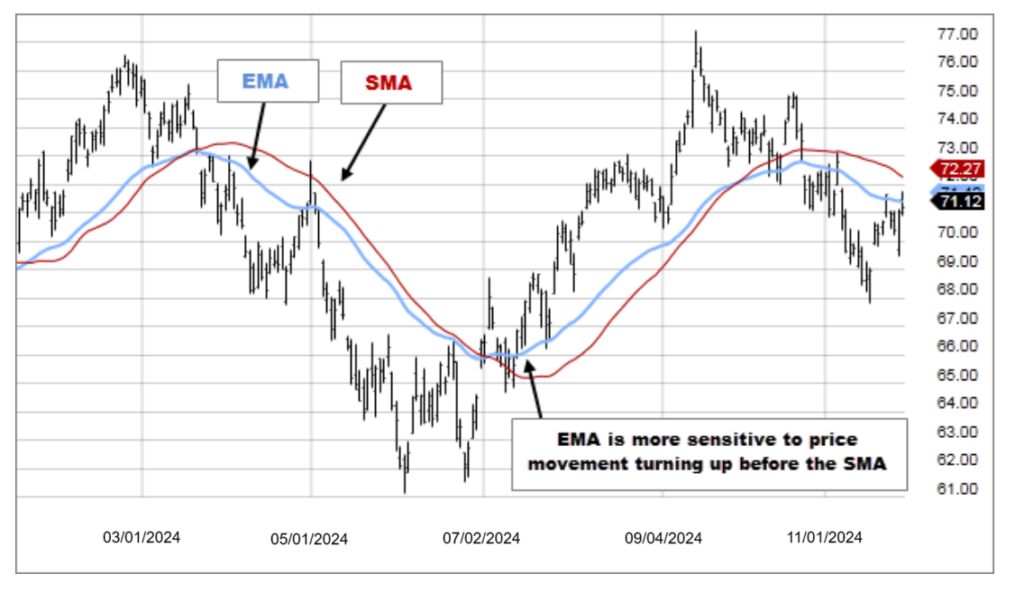
The EMA is one of the most widely used indicators for scalping because it responds more quickly to recent price changes than older price changes. Short-term EMAs like the 5-period, 9-period, and 21-period are commonly used to track immediate trend direction.
How to use it:
- Many scalpers look for a bounce or pullback to the 9 EMA in an uptrend, confirming entries when the price respects the level with increased volume
- Buy when price crosses above the EMA with high volume
- Use EMA crossovers (e.g., 5 EMA crossing above 9 EMA) as momentum signals
Best timeframe: 1-minute to 5-minute charts
2. Relative Strength Index (RSI)
The RSI is a momentum oscillator that measures the speed and change of price movements, ranging from 0 to 100. While typically associated with overbought or oversold signals, RSI can also detect micro-shifts in momentum.
How to use it:
- Overbought (above 70): Potential sell signal
- Oversold (below 30): Potential buy signal
- Watch for RSI crossing the 50 level on lower timeframes (M1–M5) before entering a trade
- Look for divergence between price and RSI—a powerful leading indicator of trend reversals
Optimized settings:
- For 1-minute charts: RSI period of 7
- For 5-minute charts: RSI period of 10
- Standard setting of 14 can be used for smoother signals

3. Bollinger Bands
Bollinger Bands consist of a middle line (usually a 20-period moving average) and two standard deviation lines above and below it. They provide valuable information about volatility and potential price reversals.
How to use it:
- Price touches lower band: Potential buy signal (oversold)
- Price touches upper band: Potential sell signal (overbought)
- Bands tightening (squeeze): Imminent volatility explosion—prepare for a breakout
- In a ranging market, buy near the lower band and exit at the middle band
Optimal settings:

4. VWAP (Volume Weighted Average Price)
VWAP helps identify whether the price is trading above or below the average institutional entry level for the session. It calculates the average price of an asset based on the volume bought over a certain period.
How to use it:
- Price bouncing off VWAP with supporting volume often signals high-probability scalping opportunities
- Price above VWAP = bullish bias; price below VWAP = bearish bias
- Works best for short-term trades, making it ideal for scalping
Best timeframe: Intraday, especially during high-volume sessions like London or New York opens

5. MACD (Moving Average Convergence Divergence)
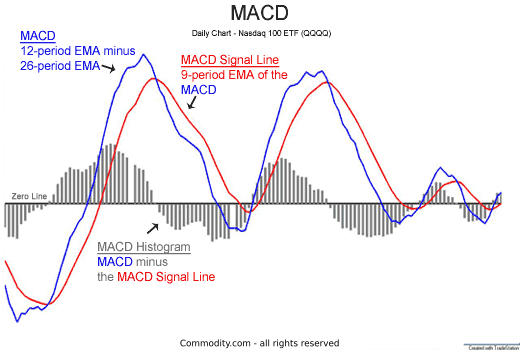
The MACD is a trend-following momentum indicator that shows the relationship between two moving averages. It helps capture momentum changes and follow trends.
How to use it:
- MACD crosses above signal line: Buy signal
- MACD crosses below signal line: Sell signal
- Divergence between price and MACD suggests potential reversals
- Typically used as a secondary confirmation tool rather than a primary trigger due to its lagging nature
Optimized settings:
- Fast EMA: 12, Slow EMA: 26, Signal: 9 (standard)
- Scalpers often use shorter periods for more responsiveness
6. Stochastic Oscillator
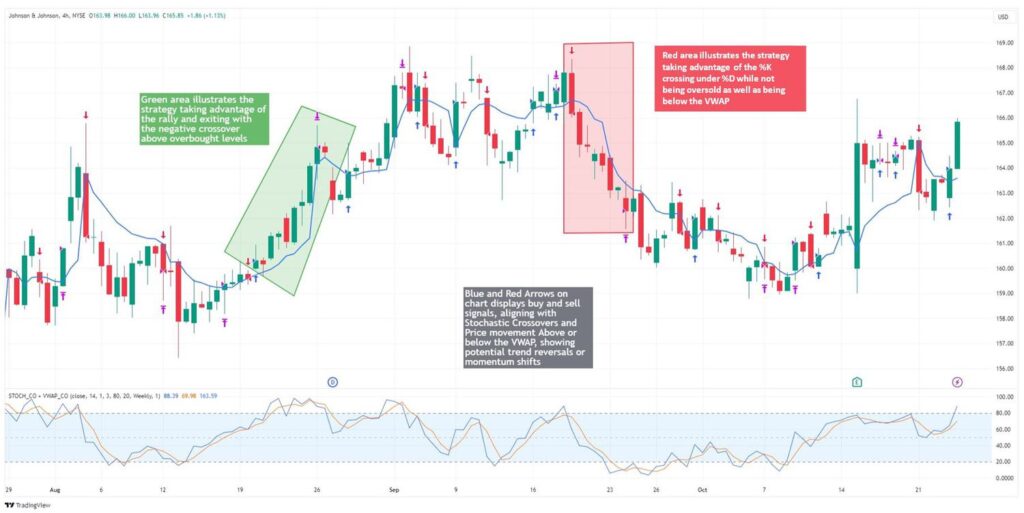
The Stochastic Oscillator is a momentum indicator that compares the closing price of an asset to a range of its prices over a specific period. It identifies overbought and oversold conditions, which can signal potential trend reversals.
How to use it:
- Above 80: Overbought—potential sell
- Below 20: Oversold—potential buy
- For 1-minute charts: Settings like 9,3,3 are commonly used
- For 5-minute charts: 14,3,3 works well
Optimized settings:
- Short %K Period: 9 or 10 (highly responsive to rapid price changes)
- Short %D Period: 3 (smooths out %K readings)
- Overbought level: 85, Oversold level: 15 (filters out false signals)
7. Parabolic SAR (Stop and Reverse)
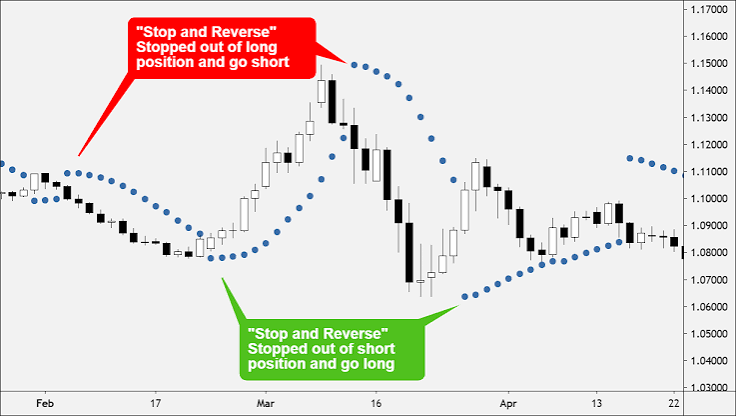
The Parabolic SAR displays chart points below the price during an upward trend and above the price during a downward trend. It helps determine short-term momentum and assists in placing stop-loss orders.
How to use it:
- Dots below price: Uptrend—consider buying
- Dots above price: Downtrend—consider selling
- When dots change position, expect a potential trend reversal
- Works best when markets are demonstrating steady trends
How to Combine Indicators for Maximum Effectiveness
Scalpers rarely rely on a single indicator. Instead, they combine two or three tools to build a setup. Here are some proven combinations:
Advanced Indicator Setup: The Scalping Suite
For traders seeking a comprehensive solution, advanced indicator suites combine multiple tools into one interface. One such suite (designed for 1-15 minute timeframes) includes:
| Component | Function |
|---|---|
| RSI | Identifies overbought/oversold conditions with divergence detection |
| EMA Ribbon (8/21/55) | Visual trend identification with color-coded fills |
| VWAP | Tracks institutional interest and intraday bias |
| ATR | Measures market volatility and filters out low-volatility periods |
| ADX | Quantifies trend strength (>25 = trending, <25 = range-bound) |
| Higher Timeframe Trend | Aligns trades with larger market direction |
Signal Tiers:
- STRONG Signals (3+ confirmations): High-probability setups combining RSI extremes, divergences, VWAP position, and EMA alignment
- MEDIUM Signals (2 confirmations): Balanced risk/reward setups for active scalpers
- WEAK Signals (1 confirmation): Early warning signals for aggressive traders
Key Factors in Choosing Scalping Indicators
1. Speed and Responsiveness
Indicators must be fast and reactive. Delayed signals can lead to poor entries and missed opportunities. Prioritize:
- Low-latency indicators that provide real-time data
- Fast-moving oscillators like Stochastic and RSI
- Short-period moving averages (e.g., 5-period and 10-period EMAs)
2. Accuracy and Signal Filtering
Balance sensitivity and accuracy. If an indicator generates too many signals, it may lead to false entries. Enhance accuracy by:
- Using multiple indicators for confirmation
- Applying adaptive smoothing techniques to minimize market noise
- Selecting indicators with adjustable sensitivity
3. Compatibility with Low Timeframes
Since scalping is done on M1, M5, and M15 charts, indicators must be optimized for lower periods. They should:
- Be effective in high-frequency trading environments
- Generate clear entry and exit signals that are easy to interpret within seconds
Transaction Cost Visualizer
Common Mistakes to Avoid
Quick Reference: Indicator Settings
| Indicator | Recommended Setting | Best Timeframe |
|---|---|---|
| EMA | 5, 9, or 21-period | 1-5 minutes |
| RSI | 7 (1-min), 10 (5-min), or 14 | 1-5 minutes |
| Bollinger Bands | 20-period SMA, 2.0 SD | 1-5 minutes |
| MACD | 12, 26, 9 (or shorter) | 1-5 minutes |
| Stochastic | 9,3,3 (1-min) or 14,3,3 (5-min) | 1-5 minutes |
| VWAP | Default intraday | All intraday |
Final Word
Scalping indicators are essential tools that provide structure, reduce emotional decision-making, and define repeatable setups. The best indicators for scalping include EMA, RSI, Bollinger Bands, VWAP, MACD, and the Stochastic Oscillator.
What matters most isn’t the indicator itself—it’s how well it integrates with your scalping trading strategy, and how quickly it delivers clear, usable signals. Remember:
- Combine indicators for confirmation
- Match indicators to market conditions (trending vs ranging)
- Prioritize speed and responsiveness over complexity
- Always use proper risk management—no indicator is perfect
Disclaimer: This article is for educational purposes only and does not constitute financial advice. Scalping involves high risk. Always consult a licensed financial advisor before making investment decisions.

