

USD/ZAR Forecast: Could the Rand Strengthen Towards 15.73?
The USD/ZAR exchange rate is back near the 16.00 area after falling from above 16.25 in August. A key level for traders to watch is 16.24724, while 15.72838 could become the next major downside target if sellers regain control.
The South African rand has recently shown renewed strength against the US dollar, with USD/ZAR trading around 16.00 on Monday, 24 August 2026. The move comes after the rand reached its strongest level since the start of the Iran war, supported by a weaker US dollar, higher gold prices and broader emerging-market currency strength.
From a technical perspective, however, the next important question is whether USD/ZAR can retest the 16.24724 area and fail, or whether buyers will reclaim that level and push the pair higher.
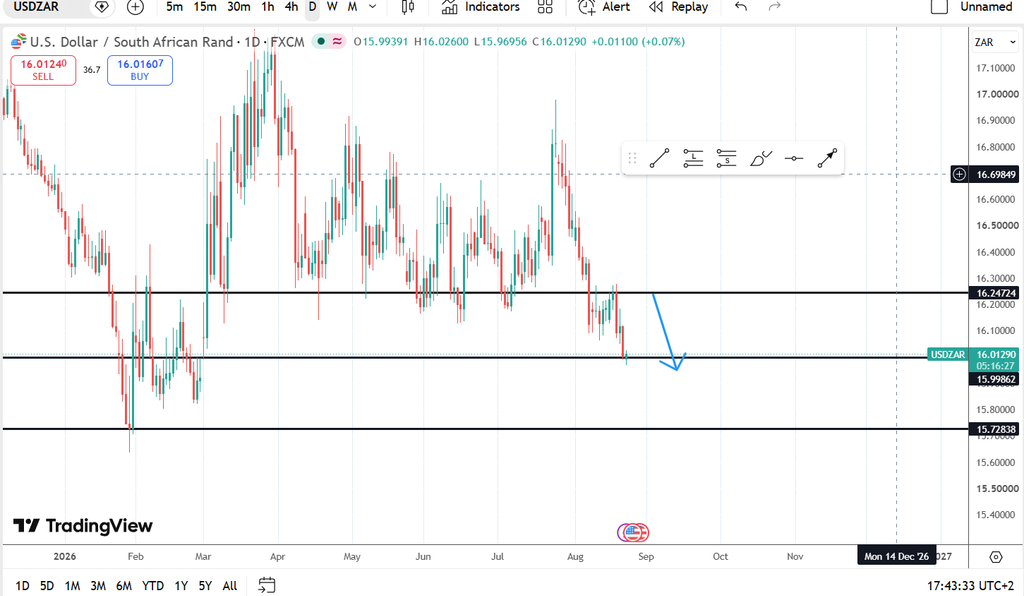
USD/ZAR Forecast Technical View
The key levels in this setup are:
| Level | Technical significance |
|---|---|
| 16.24724 | Key resistance / potential retest level |
| 16.00 | Current psychological area |
| 15.72838 | Major downside target |
| Below 15.72838 | Stronger bearish confirmation |
The central idea is straightforward:
If USD/ZAR retests 16.24724 from below and gets rejected, sellers could remain in control.
A sustained move towards 15.72838 would then become the next area to watch.
However, this is a technical scenario rather than a guaranteed forecast.
Why 16.24724 Matters for USD/ZAR
The 16.24724 level is important in this setup because of the way price interacted with the area during August.
USD/ZAR closed at approximately 16.1402 on 7 August, after reaching an intraday high around 16.3812. The pair subsequently moved back above 16.20 and traded around the 16.25–16.28 region on 17–19 August.
On 18 August, USD/ZAR closed around 16.2584, while the following session saw a high around 16.2824 before the pair fell sharply to close near 16.0980.
That price action makes the 16.24–16.28 region an area worth monitoring.
If price approaches 16.24724 from underneath and sellers appear again, traders could interpret that as a potential resistance retest.
Could USD/ZAR Retest 16.24724?
Yes, that is a plausible technical scenario.
A market does not always move directly from one support or resistance level to the next. After a sharp move lower, price can retrace toward a previously broken level before continuing in the original direction.
For this setup, the sequence would look something like:
USD/ZAR falls → retraces toward 16.24724 → fails to reclaim the level → sellers return → downside resumes.
That would create a classic support-turned-resistance setup.
The important part is not simply whether USD/ZAR touches 16.24724.
The more important question is:
What does price do when it gets there?
A rejection would strengthen the bearish case.
A clean break above the level would weaken it.
What Would Confirm the Bears Are Taking Control?
The stronger confirmation in this setup would come from a sustained break below 15.72838.
Why?
Because 15.72838 is the next major downside level in this technical scenario. If price reaches that area and buyers cannot defend it, the market structure would become considerably more bearish.
The setup can therefore be divided into three stages:
Stage 1: Retest 16.24724
USD/ZAR moves back toward the previous key level.
Stage 2: Rejection
The pair fails to reclaim 16.24724 and begins moving lower again.
Stage 3: Break 15.72838
A decisive move below 15.72838 would provide stronger evidence that sellers have taken control of the broader move.
Until that happens, the 15.72838 target should be treated as a technical scenario rather than a confirmed destination.
What If USD/ZAR Breaks Above 16.24724?
This is the biggest risk to the bearish setup.
If USD/ZAR climbs back above 16.24724 and holds there, the support-turned-resistance thesis would be invalidated or at least weakened.
A sustained move above the level could indicate that buyers have regained control and that the market is preparing for another move higher.
This is why traders should avoid treating one price level as a guaranteed turning point.
16.24724 is a decision zone, not a prediction machine.
The reaction around that level is what matters.
USD/ZAR Has Already Moved Significantly Lower
The broader price action supports why the retest scenario is worth watching.
USD/ZAR was trading above 16.50 at the end of July. Historical data shows the pair closed at 16.5488 on 31 July, before falling through much of the first half of August.
By 21 August, USD/ZAR had fallen to a close around 16.0179, with an intraday low near 15.9806.
On 24 August, the pair was around 16.00, according to available market data.
That means the pair has already experienced a substantial decline from its late-July levels.
This is important because after a large move lower, traders should be prepared for counter-trend rebounds rather than assuming price will continue falling in a straight line.
Why Is the South African Rand Strengthening?
The USD/ZAR chart is not moving in isolation.
Recent market reports point to several factors supporting the rand.
The South African currency has benefited from a weaker US dollar and stronger gold prices. Because South Africa is a major commodity producer, movements in commodity prices can influence sentiment toward the rand.
South Africa’s inflation picture has also recently provided some support. Reuters reported on 19 August that softer-than-expected inflation helped the rand strengthen, with food inflation, municipal tariff increases and fuel prices contributing to the moderation in headline price pressures.
At the same time, geopolitical developments remain an important source of volatility for emerging-market currencies.
For USD/ZAR traders, this means the technical picture needs to be monitored alongside global risk sentiment, the US dollar and commodities.
What Happens If 15.72838 Breaks?
A decisive break below 15.72838 would be the most important confirmation in this bearish scenario.
It would indicate that USD/ZAR has moved beyond the immediate support area identified in this analysis.
From a technical perspective, traders could then begin looking for additional lower support zones rather than assuming the decline stops exactly at 15.72838.
However, a temporary intraday move below the level would not necessarily be enough.
A stronger signal would be:
Break → hold below → failed recovery → continuation lower.
That would provide a more convincing indication that the bears have taken control.
What Would Invalidate the Bearish USD/ZAR View?
The bearish setup would become weaker if USD/ZAR:
- Reclaims 16.24724
- Holds above the level
- Builds higher highs and higher lows
- Breaks through nearby resistance
- Shows sustained buying momentum
The most important level to monitor initially is therefore 16.24724.
If sellers defend it, the bearish scenario remains interesting.
If buyers reclaim it convincingly, the setup needs to be reassessed.
USD/ZAR Forecast: Bullish vs Bearish Scenario
Bearish Scenario
USD/ZAR retests 16.24724 → rejection → move lower → test 15.72838.
A break below 15.72838 would provide stronger confirmation of continued downside.
Neutral Scenario
USD/ZAR remains trapped between the key levels, with price consolidating around 16.00–16.25.
This would indicate that neither buyers nor sellers have established clear control.
Bullish Scenario
USD/ZAR breaks above 16.24724 and holds above it.
That would weaken the bearish setup and could open the door to a recovery toward higher resistance levels.
Key USD/ZAR Levels to Watch
For traders following the pair, these are the levels highlighted by this analysis:
16.24724 — Key resistance
This is the main level to watch for a potential bearish retest.
16.00 — Psychological level
USD/ZAR is currently trading around this area, making it an important short-term reference point.
15.72838 — Major downside target
A move toward this level would represent the next major bearish objective in the scenario.
Below 15.72838 — Bearish confirmation
A decisive break and sustained move below this level would strengthen the case that sellers have taken control.
Frequently Asked Questions
What is the USD/ZAR forecast for 2026?
The short-term USD/ZAR outlook depends on whether the pair can reclaim key resistance levels. In this technical scenario, 16.24724 is the key level to watch, while 15.72838 is the major downside target if sellers remain in control.
What is the key resistance level for USD/ZAR Forecast 2026?
For this analysis, 16.24724 is the key resistance level. A rejection there would support the bearish scenario, while a sustained move above it would weaken the setup.
What is the next downside target for USD/ZAR?
The next major downside level highlighted in this analysis is 15.72838.
What would confirm that USD/ZAR bears have taken control?
A rejection from 16.24724 followed by a decisive break below 15.72838 would provide stronger technical confirmation that sellers have taken control.
Why is the rand strengthening against the dollar?
Recent rand strength has been supported by factors including a weaker US dollar, higher gold prices and improved emerging-market sentiment. Softer South African inflation has also recently supported the currency.
Is USD/ZAR going to fall to 15.72838?
It is not possible to know with certainty. The level is a technical downside target in this scenario. Price would first need to show continued bearish momentum and eventually break relevant support levels.
Final USD/ZAR Outlook
The 16.24724 level is the key test for this USD/ZAR setup.
If the pair climbs back toward that level and sellers successfully defend it, the market could set up for another move lower, with 15.72838 becoming the next major level to watch.
The more convincing bearish confirmation would come from a decisive break below 15.72838.
On the other hand, if USD/ZAR reclaims 16.24724 and establishes itself above the level, the bearish thesis would weaken and the chart would need to be reassessed.
For now, the cleanest way to frame the setup is:
16.24724 = resistance to watch.
15.72838 = bearish target.
Below 15.72838 = stronger confirmation.
This is technical analysis, not financial advice. Currency markets can move sharply in response to economic data, central-bank decisions, geopolitical developments and changes in global risk sentiment. Always manage risk appropriately and do your own research before trading.

