
Trading Indicators: A Complete Guide for Beginners
Trading Indicators: A Complete Guide for Beginners
Trading indicators are essential tools used by traders to analyze financial markets and make informed decisions. Whether you’re trading crude oil, forex, stocks, or cryptocurrencies, indicators help you understand price movements, identify trends, and improve your overall strategy.
Platforms like TradingView provide access to hundreds of indicators that traders can use to gain insights into the market.
Trading Indicators: A Complete Guide for Beginners
What Are Trading Indicators?
Trading indicators are mathematical calculations based on an asset’s price, volume, or open interest. These indicators are displayed on charts and help traders:
- Identify trends
- Spot entry and exit points
- Measure momentum
- Confirm market signals
They are a key part of technical analysis, which focuses on price action rather than fundamental news.

Types of Trading Indicators
Trading indicators are generally divided into four main categories:
1. Trend Indicators
Trend indicators help traders determine the direction of the market.
Popular Trend Indicators:
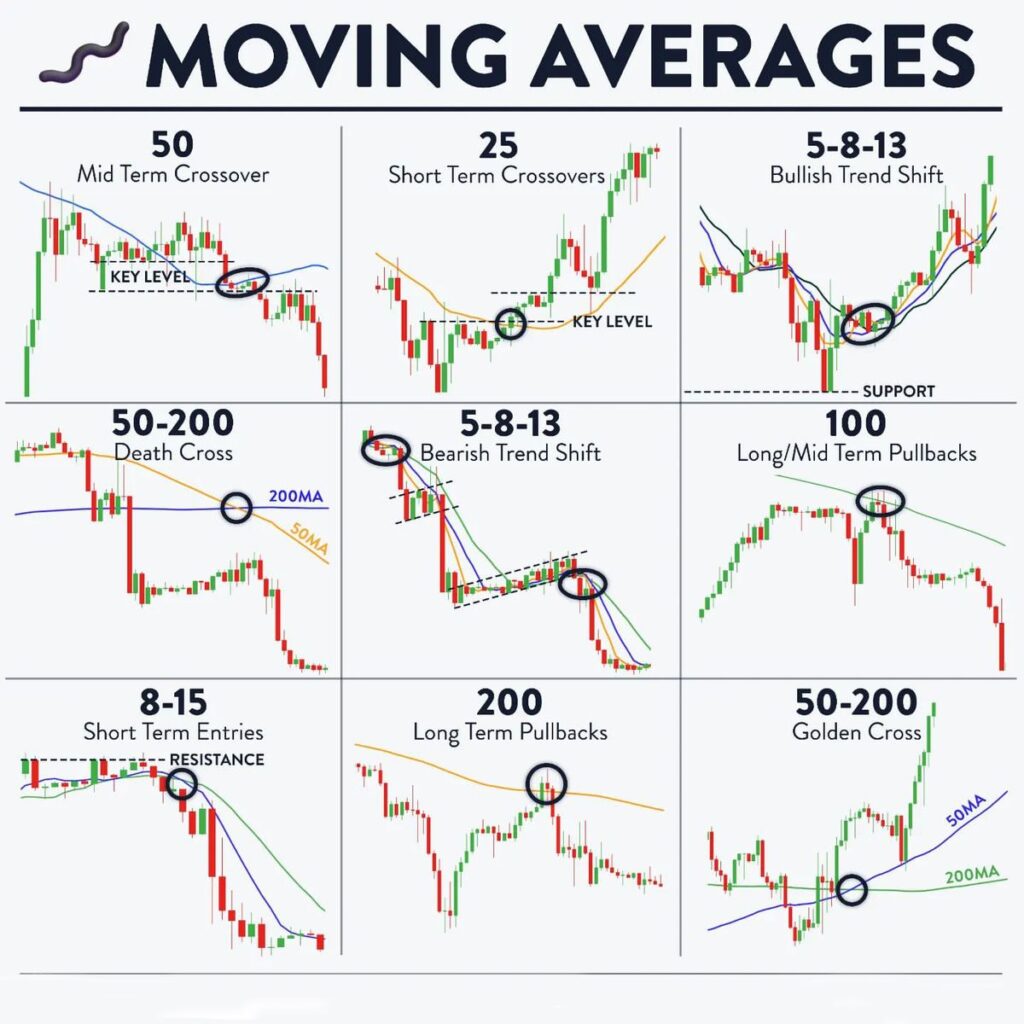
- Moving Averages (MA)
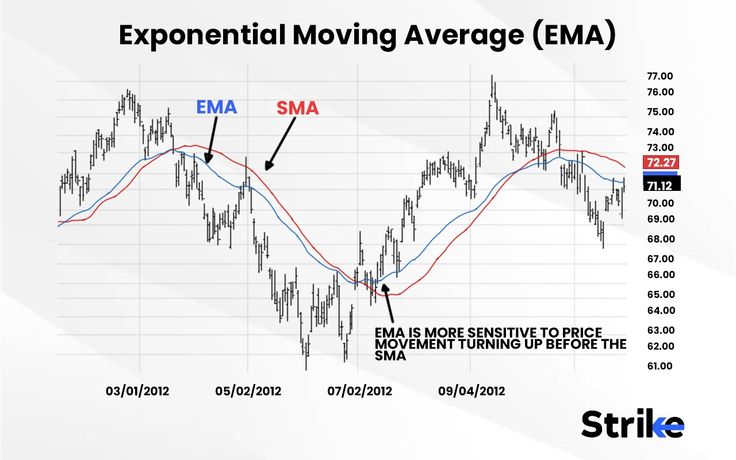
- Exponential Moving Average (EMA)
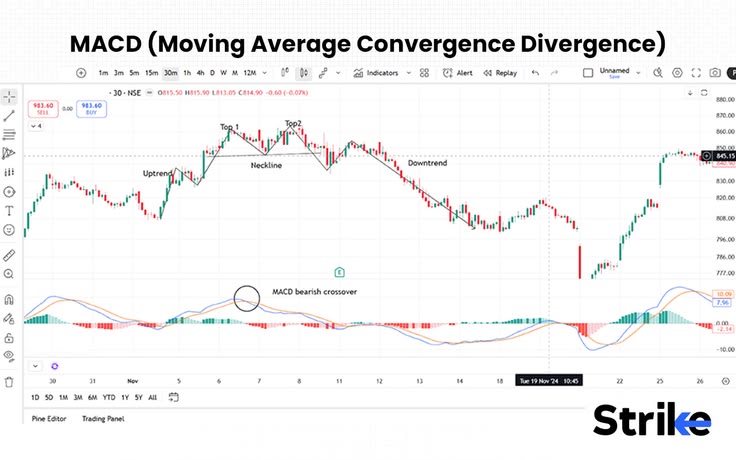
- MACD (Moving Average Convergence Divergence)
How They Work:
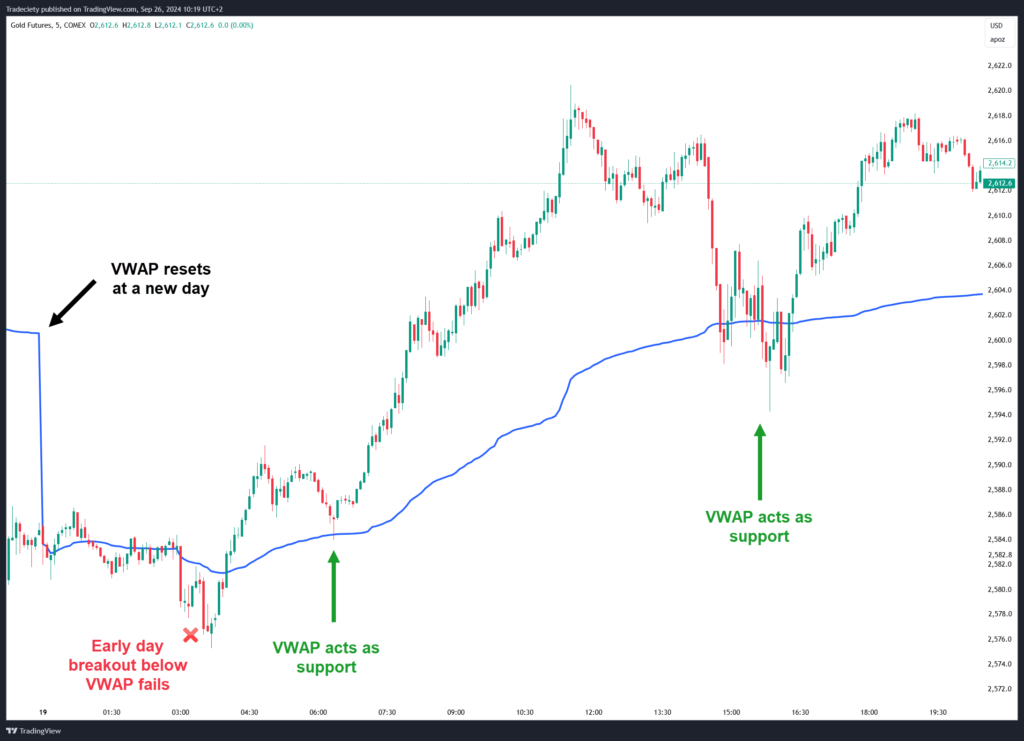
These indicators smooth out price data to show whether the market is trending upward or downward.
Example:
If price is above the moving average, the market is considered bullish.
If price is below, it’s considered bearish.
2. Momentum Indicators
Momentum indicators measure the speed and strength of price movements.
Popular Momentum Indicators:
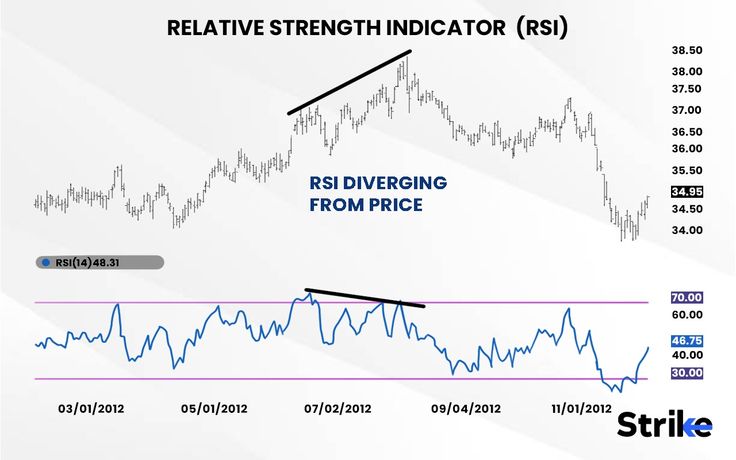
- Relative Strength Index (RSI)
- Stochastic Oscillator
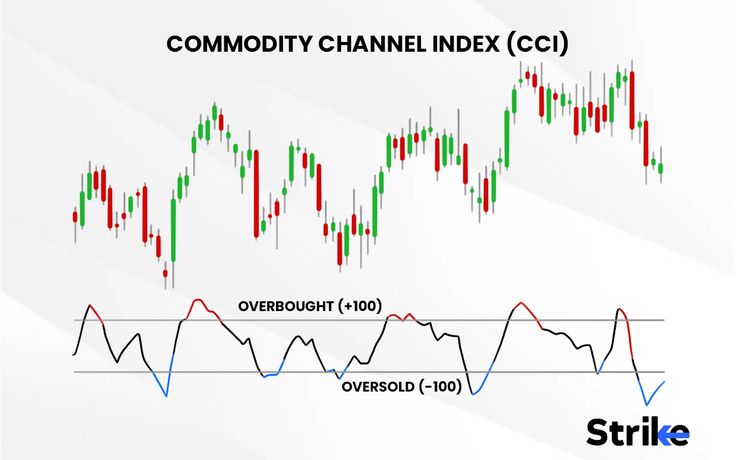
- CCI (Commodity Channel Index)

How They Work:
They help traders identify overbought or oversold conditions.
Example:
- RSI above 70 = Overbought (possible sell)
- RSI below 30 = Oversold (possible buy)
3. Volatility Indicators
Volatility indicators measure how much the price is moving.
Popular Volatility Indicators:
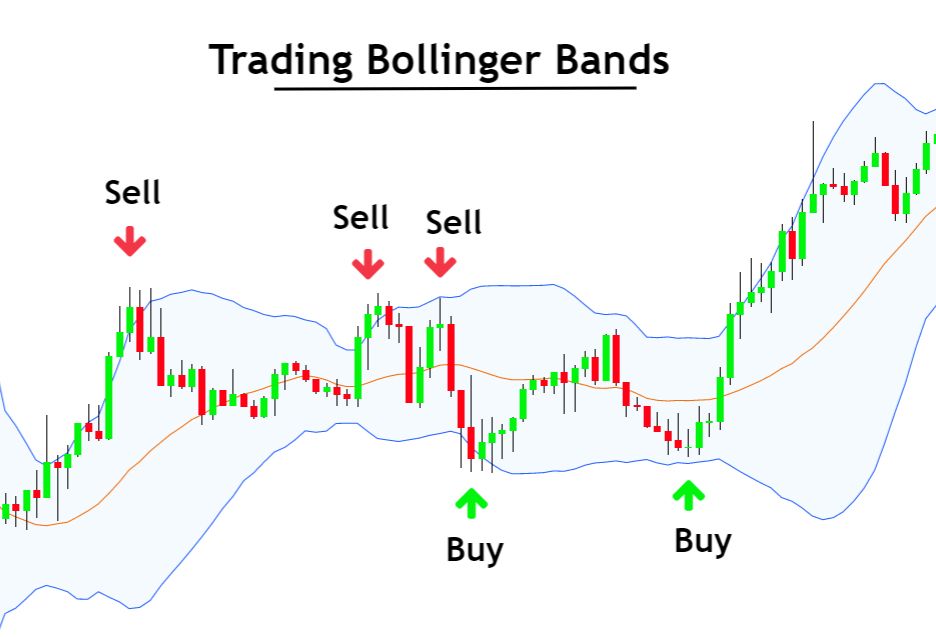
- Bollinger Bands
- Average True Range (ATR)

How They Work:
They show whether the market is calm or highly volatile.
Example:
When Bollinger Bands widen, volatility is increasing.
When they tighten, the market is consolidating.
4. Volume Indicators
Volume indicators analyze the number of trades happening in the market.
Popular Volume Indicators:
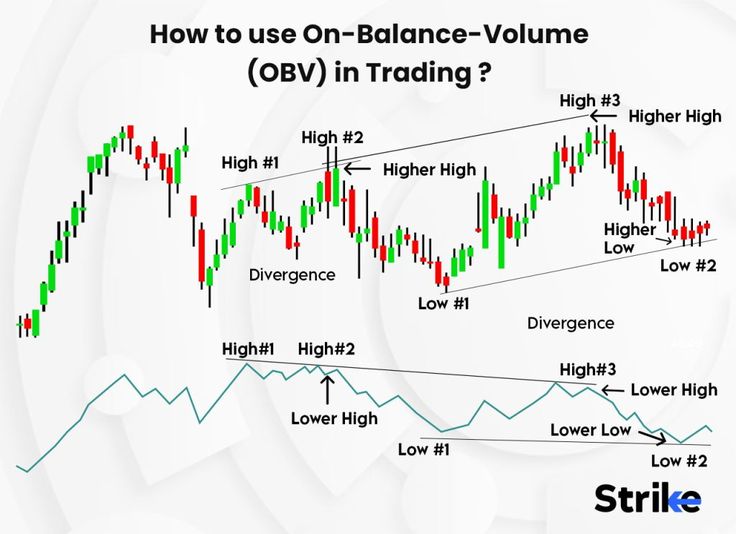
- On-Balance Volume (OBV)
- Volume Profile

How They Work:
They confirm whether a trend is strong or weak.
Example:
- Rising price + high volume = strong trend
- Rising price + low volume = weak trend
Most Popular Trading Indicators Explained
Moving Averages (MA & EMA)
Moving averages are among the most widely used indicators in trading.
- MA gives equal weight to all prices
- EMA gives more weight to recent prices
Traders often use the 50-day and 200-day moving averages to identify long-term trends.
Relative Strength Index (RSI)
The RSI measures momentum on a scale of 0 to 100.
- Above 70 → Overbought
- Below 30 → Oversold
It is useful for spotting potential reversals.
MACD Indicator
The MACD shows the relationship between two moving averages.
It consists of:
- MACD Line
- Signal Line
- Histogram
When the MACD line crosses above the signal line → Buy signal
When it crosses below → Sell signal
Bollinger Bands
Bollinger Bands consist of:
- Middle band (moving average)
- Upper band
- Lower band
They help identify volatility and breakout opportunities.
How to Use Trading Indicators Effectively
Using indicators correctly is key to becoming a profitable trader.
1. Combine Indicators
Avoid relying on a single indicator. Combine:
- Trend indicator (e.g., MA)
- Momentum indicator (e.g., RSI)
- Volume confirmation
2. Avoid Indicator Overload
Using too many indicators can confuse your analysis.
Stick to 2–3 indicators maximum for clarity.
3. Match Indicators to Market Conditions
Different indicators work better in different markets:
- Trending market → Moving averages, MACD
- Sideways market → RSI, Bollinger Bands
4. Always Use Risk Management
Indicators are not 100% accurate. Always use:
- Stop-loss orders
- Proper position sizing
Best Indicators for Crude Oil Trading
When trading commodities like crude oil, the following indicators are highly effective:
- Moving Averages → Identify trend direction
- RSI → Spot overbought/oversold levels
- Volume → Confirm price moves
- Bollinger Bands → Detect volatility
These tools are commonly used on platforms like TradingView to analyze USOIL charts.
Common Mistakes Traders Make
1. Relying on Indicators Alone
Indicators should support your strategy, not replace it.
2. Ignoring Market Structure
Always consider:
- Support and resistance
- Trendlines
- Price action
3. Overtrading Signals
Not every signal is a good trade. Wait for confirmation.
Trading indicators are powerful tools that can help traders analyze markets and improve decision-making. However, they should always be used alongside:
- Price action
- Market structure
- Risk management
By mastering a few key indicators and using platforms like TradingView, traders can build a more consistent and disciplined trading strategy.
For more trading education and market insights, visit InvestInSA.
Frequently Asked Questions (FAQ) About Trading Indicators
1. What are trading indicators?
Trading indicators are tools used in technical analysis to help traders analyze price movements, trends, and market conditions. They are based on mathematical calculations using price, volume, or time data and are commonly used on platforms like TradingView.
2. What is the best trading indicator for beginners?
There is no single “best” indicator, but beginners often start with:
- Moving Averages (MA/EMA)
- Relative Strength Index (RSI)
- MACD
These indicators are easy to understand and widely used in the trading community.
3. How many indicators should I use when trading?
Most professional traders recommend using 2 to 3 indicators maximum. Using too many indicators can lead to confusion and conflicting signals.
4. Are trading indicators accurate?
Trading indicators are not 100% accurate. They provide signals based on historical data, so traders should always combine them with:
- Price action
- Market structure
- Risk management
5. What is the difference between leading and lagging indicators?
- Leading indicators (like RSI) try to predict future price movements
- Lagging indicators (like Moving Averages) confirm trends after they have started
Both types are useful when used together.
6. Can I use trading indicators for all markets?
Yes, trading indicators can be used across multiple markets, including:
- Forex
- Stocks
- Cryptocurrencies
- Commodities (like crude oil)
They work on any market that has price charts.
7. Which indicators are best for trend trading?
For trend trading, the most effective indicators include:
- Moving Averages
- MACD
- Trendlines
These help traders identify the overall market direction.
8. Which indicators are best for spotting reversals?
To identify potential reversals, traders often use:
- RSI
- Stochastic Oscillator
- Bollinger Bands
These indicators highlight overbought and oversold conditions.
9. Do professional traders use indicators?
Yes, many professional traders use indicators, but they combine them with experience, price action analysis, and risk management strategies rather than relying on indicators alone.
10. Where can I learn more about trading indicators?
You can learn more about trading indicators through educational platforms like InvestInSA and by practicing on charting tools such as TradingView.

