

What Is Bullish? Definition, Meaning, and How to Trade in Up Markets
What Does Bullish Mean?
Bullish is a term used to describe an optimistic outlook on the price of an asset or the overall market. When you are bullish, you believe prices will rise—and you position yourself to profit from that upward movement.
A bullish investor expects:
- Stock prices to increase
- Market indices (like the JSE Top 40 or S&P 500) to climb
- Economic conditions to improve
- Buying pressure to outweigh selling pressure
The term comes from the way a bull attacks: thrusting its horns upward. This contrasts with a bear, which swipes its paws downward, representing falling prices.
Bullish vs. Bearish: Key Differences
| Aspect | Bullish | Bearish |
|---|---|---|
| Outlook | Prices will rise | Prices will fall |
| Emotion | Optimism, confidence | Caution, skepticism |
| Primary Action | Buy, hold, accumulate | Sell, short, hedge |
| Market Condition | Bull market | Bear market |
| Risk | Buying at peaks, overvaluation | Short squeezes, rapid reversals |
What Is a Bull Market?
A bull market is a prolonged period of rising prices, typically defined as a 20% or more increase from recent lows across a major index. Bull markets often coincide with:
- Strong economic growth
- Low unemployment
- Rising corporate profits
- High investor confidence
- Increased trading volume
Bull markets can last for months or even years. Historically, bull markets have lasted significantly longer than bear markets.
Characteristics of a Bull Market
| Characteristic | Description |
|---|---|
| Higher highs and higher lows | Price action consistently moves upward over time |
| Strong volume | Buying volume confirms upward moves |
| Positive sentiment | News and media reflect optimism |
| Economic expansion | GDP growth, low unemployment |
| IPO activity | More companies go public |
Common Bullish Strategies
If you believe prices are headed higher, here are the most common ways to position yourself.
1. Buying (Going Long)
The simplest bullish strategy: buy an asset with the expectation of selling it later at a higher price. This applies to stocks, cryptocurrencies, forex, commodities, and other assets.
2. Call Options
A call option gives you the right (but not the obligation) to buy an asset at a predetermined price before a specific expiration date. When the asset’s price rises, the value of the call option typically increases.
Advantage: Limited risk (only the premium paid) with potentially unlimited upside.
3. Bullish ETFs
Exchange-traded funds (ETFs) that track rising markets. For example, buying an S&P 500 ETF (like SPY) gives you diversified bullish exposure to the US market.
4. Buying on Dips
A common bullish strategy where investors buy during temporary price declines (pullbacks) within an overall uptrend. The belief is that the upward trend will resume.
5. Leveraged Bullish Products
Some ETFs offer leveraged exposure (e.g., 2x or 3x daily returns). While these can amplify profits, they also carry significantly higher risk and are generally recommended for short-term trading only.
Bullish Technical Indicators
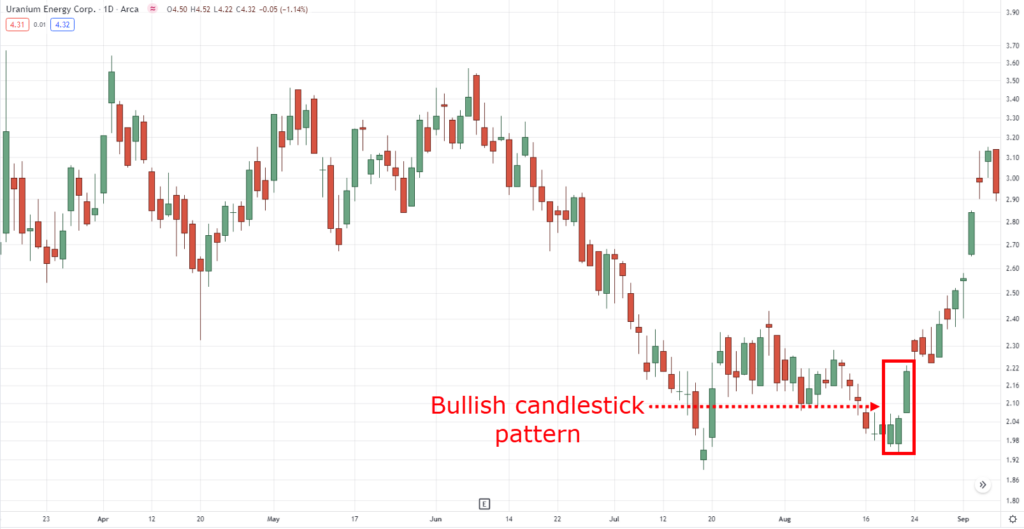
Technical traders use a variety of indicators to confirm bullish conditions and identify entry points.
Golden Cross
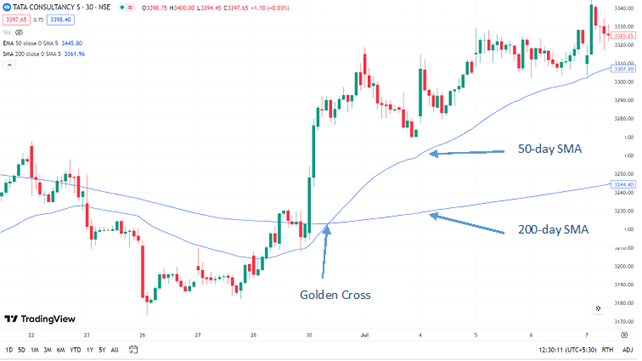
The golden cross occurs when a short-term moving average (typically the 50-day) crosses above a long-term moving average (typically the 200-day). This is widely regarded as a strong bullish signal.
Bullish Divergence
Bullish divergence occurs when the price makes a lower low, but a momentum indicator (such as the Relative Strength Index or RSI) makes a higher low. This suggests downward momentum is weakening, and a reversal to the upside may be imminent.
Breakout Above Resistance
Resistance is a price level where selling pressure typically emerges. When an asset breaks above a well-established resistance level on significant volume, it is called a breakout—a strong bullish signal.
Higher Highs and Higher Lows
The hallmark of a bullish trend: each successive peak is higher than the previous peak, and each trough is higher than the previous trough.
Bull Flag Pattern
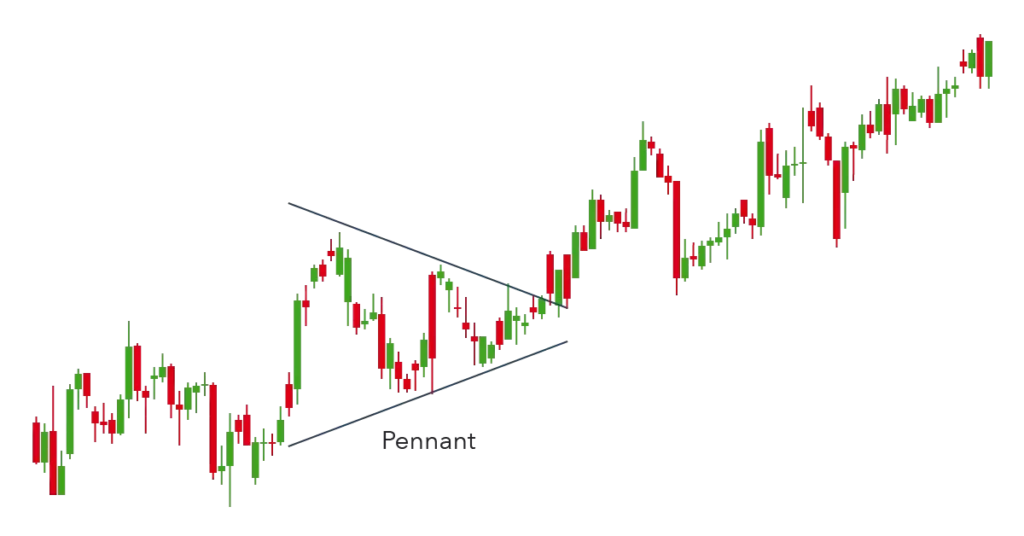
A bull flag is a continuation pattern that appears as a brief consolidation (the “flag”) following a sharp upward move (the “pole”). A breakout above the flag signals the uptrend is resuming.
Bullish Sentiment Indicators
Sentiment indicators help traders gauge whether optimism has reached extreme levels—which can sometimes signal a contrarian warning.
| Indicator | Bullish Signal |
|---|---|
| Put/Call Ratio | A low ratio (more calls than puts) indicates bullish sentiment |
| AAII Sentiment Survey | High percentage of bullish respondents indicates optimism |
| VIX (Fear Index) | Low VIX readings indicate complacency and confidence |
| Margin Debt | Rising margin debt suggests investors are borrowing to buy |
Contrarian Note: When bullish sentiment reaches extreme highs, it can sometimes signal a market top—if everyone who wants to buy has already bought, there may be no buyers left to push prices higher.

Bullish Fundamentals
Beyond technical analysis, bullish traders look for fundamental factors that support rising prices.
For Individual Stocks
- Earnings growth: Consistent revenue and profit increases
- Strong balance sheet: Low debt, healthy cash flow
- Competitive advantage: Moat, market share, brand strength
- Positive news: Product launches, partnerships, analyst upgrades
For the Overall Market
- Interest rate cuts: Lower rates reduce borrowing costs and encourage investment
- Low inflation: Stable prices support consumer spending
- GDP growth: Economic expansion drives corporate profits
- Strong employment: Low unemployment supports consumer spending
Bullish vs. Bear Market: Comparison
| Bull Market | Bear Market | |
|---|---|---|
| Price trend | Rising | Falling |
| Duration | Longer (average 5–9 years) | Shorter (average 1–2 years) |
| Investor psychology | Optimism, greed | Pessimism, fear |
| Economic backdrop | Growth, expansion | Recession, contraction |
| Best strategy | Buy and hold, accumulate | Defensive positioning, shorting |
Famous Bull Markets in History
| Period | Market | Key Characteristics |
|---|---|---|
| 1982–2000 | US Stocks | One of the longest bull markets in history; rise of technology and dot-com boom |
| 2009–2020 | Global Markets | Post-financial crisis recovery; low interest rates; tech mega-cap dominance |
| 2003–2007 | South Africa | JSE boom driven by commodity supercycle; strong rand and resource sector growth |
| 2020–2021 | Global Markets | Rapid recovery from COVID-19 pandemic; stimulus-driven rally |
Bullish Trading Example
Let’s walk through a hypothetical bullish trade.
Scenario:
A trader analyzes XYZ stock, which has been in a clear uptrend with higher highs and higher lows. The stock recently pulled back to a key support level (the 50-day moving average) on declining volume, suggesting selling pressure is exhausted.
The Trade:
- The trader buys shares at support, placing a stop-loss just below the recent low.
- Alternatively, the trader buys a call option to limit risk.
- The target is the next resistance level, representing a measured move based on prior price action.
Outcome:
If the stock continues its uptrend and reaches the target, the trader profits. If the stock breaks below support, the stop-loss limits the loss.
Common Bullish Terms
| Term | Meaning |
|---|---|
| Long | A position that profits if the asset rises |
| Accumulation | Institutional buying; often precedes uptrends |
| Breakout | Price moves above resistance; bullish signal |
| Melt-up | Rapid, unsustainable rally driven by FOMO (fear of missing out) |
| FOMO | Fear of missing out; drives late-stage buying |
| All-time high (ATH) | Highest price ever recorded for an asset |
| Dip buying | Purchasing during temporary declines within an uptrend |
| Risk-on | Market environment where investors favor riskier assets |
Frequently Asked Questions
Is being bullish always good?
Not necessarily. While bullish markets create opportunities for profit, excessive optimism can lead to overvaluation, bubbles, and sharp corrections. Successful investors remain disciplined even in bullish environments.
Can you be bullish and still hold cash?
Yes. Many investors maintain a long-term bullish outlook while keeping cash reserves for opportunities (to buy dips) or for diversification and risk management.
What is the opposite of bullish?
The opposite of bullish is bearish—an expectation that prices will fall.
How long do bull markets last?
Bull markets vary significantly. Historically, the average bull market in US stocks has lasted approximately 5 to 9 years, though some have been shorter or longer.
Can you be bullish on one asset and bearish on another?
Absolutely. A trader might be bullish on gold but bearish on the US dollar, or bullish on technology stocks but bearish on retail stocks. Being bullish or bearish applies to specific assets, sectors, or markets—not necessarily everything at once.
Final Word
Understanding what it means to be bullish is fundamental to participating in financial markets. Whether you are a long-term investor building wealth over decades or a short-term trader seeking opportunities, bullish strategies form the foundation of most investment approaches.
Key takeaways:
- Bullish means expecting prices to rise
- Buying and call options are primary bullish strategies
- Technical patterns like golden crosses and breakouts help identify bullish opportunities
- Bull markets are prolonged periods of rising prices
- Extreme bullish sentiment can sometimes signal caution
By mastering bullish concepts, you become better equipped to identify opportunities, manage risk, and participate in the long-term growth that markets have historically delivered.
Disclaimer: This article is for educational purposes only and does not constitute financial advice. Trading involves risk, including the potential loss of principal. Always conduct your own research or consult with a qualified financial advisor before making investment decisions.

