

Inghams Group Limited Stock Analysis: High Dividend Yield or Value Trap?
Inghams Group Limited Stock Analysis
The Allure of a Double-Digit Yield
In a market environment where term deposits offer modest returns and bond yields remain relatively subdued, a 9.5% dividend yield naturally captures the attention of income-focused investors. Inghams Group Limited (ASX: ING), one of Australia and New Zealand’s largest poultry producers, currently offers exactly that—a headline-grabbing yield that seems almost too good to pass up.
But as experienced investors know, if a yield looks too good to be true, it often is.
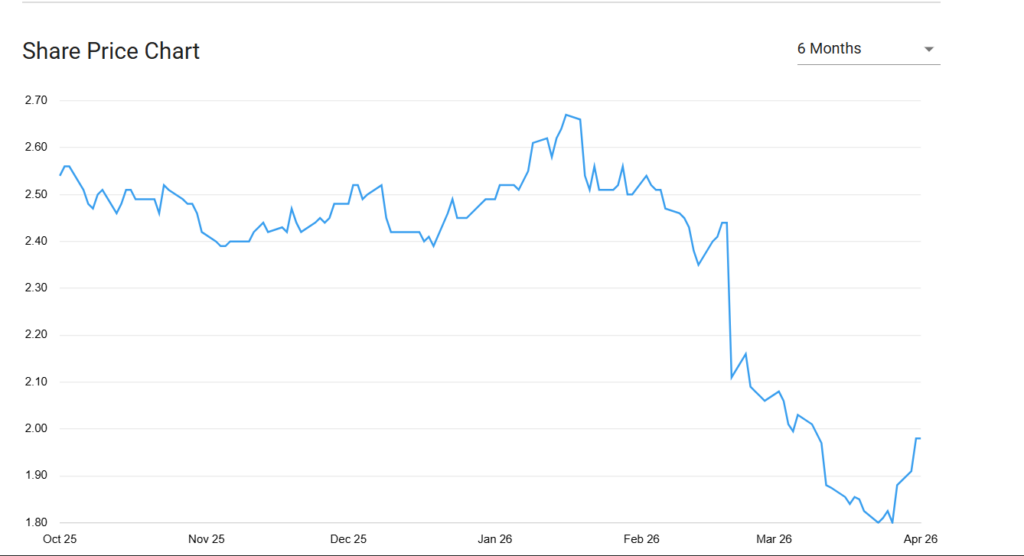
Inghams Group has seen its share price collapse by over 40% from recent highs, trading near 52-week lows while continuing to pay a substantial dividend. The central question for investors is straightforward: Is ING a genuine income opportunity, or is it a value trap—a stock that appears cheap but continues to deteriorate?
This article provides a comprehensive analysis of Inghams Group’s financial health, dividend sustainability, competitive position, and the critical factors that will determine whether this poultry giant flies again or remains grounded.
Inghams Group Limited Stock Analysis
Company Overview: Australia’s Poultry Powerhouse
History and Market Position
Founded in 1918, Inghams Group Limited has grown from a family-operated business into one of the largest integrated poultry producers in Australia and New Zealand. The company operates across the entire supply chain—from breeding and hatcheries to feed milling, farming, processing, and distribution.
| Key Facts | |
|---|---|
| Founded | 1918 |
| Headquarters | Sydney, Australia |
| Employees | ~8,200 |
| Market Cap | ~AUD 730 million |
| Revenue (TTM) | ~AUD 3.15 billion |
| ASX Ticker | ING |
| Sector | Consumer Staples |
What Does Inghams Do?
The company supplies chicken and turkey products across three primary channels:
- Retail: Supermarkets including Woolworths, Coles, and independent grocers
- Food Service: Restaurants, quick-service chains, and cafés
- Export: Select international markets
As a consumer staples business, Inghams benefits from relatively inelastic demand—people purchase poultry regardless of economic conditions. This defensive characteristic typically provides stability, yet the company has experienced significant volatility.
Stock Performance: What Has Driven the Decline?
Share Price Collapse
Over the past year, Inghams shares have declined by over 40%, trading near 52-week lows around AUD 1.88. This sharp sell-off has left many investors wondering whether the market has overreacted or whether deeper structural issues are at play.
Three Key Drivers of the Decline
1. Falling Profits
Inghams’ net income has dropped by over 37% in recent periods. The company reported net income of approximately AUD 56 million on revenue of AUD 3.15 billion. While the company remains profitable, the trajectory is concerning.
2. Revenue Stagnation
Revenue has declined slightly by 2–3%, reflecting a combination of:
- Soft consumer demand
- Increased competition from other protein sources (pork, beef, plant-based alternatives)
- Reduced volume in food service channels
3. Margin Compression
The company’s profit margin currently sits at approximately 1.79% . For a business of this scale, such thin margins leave virtually no room for error. Small increases in input costs—particularly feed grain—can quickly erode profitability.
Key Insight: Stable demand does not guarantee stable profits. Inghams is a classic example of a business with pricing power constraints facing escalating operational costs.
Dividend Analysis: Is the 9.5% Yield Sustainable?
Current Dividend Snapshot
| Dividend Metric | Value |
|---|---|
| Dividend Yield | ~9.5% |
| Annual Dividend | ~AUD 0.19 per share |
| Payment Frequency | Semi-annual |
| Payout Ratio | ~79% |
| Dividend Growth (5-year) | -36.84% |
At first glance, a 9.5% yield places Inghams among the highest-yielding stocks on the ASX. For income investors desperate for yield in a low-return environment, this is undeniably attractive.
The Sustainability Problem
However, three critical factors suggest the dividend may be at risk:
1. High Payout Ratio
A payout ratio of 79% means the company is distributing nearly four-fifths of its earnings to shareholders. With earnings declining, the payout ratio could rise even further—potentially exceeding 100%, at which point dividends would be funded by debt or cash reserves rather than profits.
2. Declining Dividend Trend
Dividends have fallen by nearly 37% over a five-year period. This is not a temporary cut but a sustained downward trend. Investors relying on this dividend for income have already seen their payouts shrink.
3. Negative Dividend Growth Outlook
When earnings are falling and margins are under pressure, the most likely outcome is either a dividend cut or stagnant payments. History shows that companies with payout ratios above 70% during earnings downturns frequently reduce or suspend dividends.
Warning: A 9.5% yield accompanied by falling earnings is a classic red flag. In many cases, such yields signal that the market expects a dividend cut.
Financial Health: A Deep Dive into the Numbers
Profitability Analysis
| Metric | Value | Assessment |
|---|---|---|
| Revenue (TTM) | AUD 3.15 billion | Stable, but slightly declining |
| Net Income (TTM) | AUD 56 million | Down 37% |
| Profit Margin | 1.79% | Dangerously thin |
| Return on Equity (ROE) | ~5% | Below cost of equity |
The profitability picture is concerning. A 1.79% margin in a capital-intensive industry provides minimal cushion against cost increases, competitive pressure, or volume declines.
Cash Flow Analysis
| Metric | Value |
|---|---|
| Operating Cash Flow | ~AUD 170 million |
| Free Cash Flow (FCF) | ~AUD 170 million |
Positive: Free cash flow remains robust at approximately AUD 170 million. This is the single most important factor supporting the current dividend. Unlike earnings, which include non-cash items, cash flow represents actual money the company generates.
Critical Question: Can cash flow sustain the dividend if earnings continue to fall? Currently, dividends consume a significant portion of free cash flow. Any further decline in cash generation would pressure the payout.
Debt and Leverage
| Metric | Value |
|---|---|
| Total Debt | ~AUD 1.49 billion |
| Net Debt | Significantly high relative to market cap |
| Debt-to-Equity | Elevated |
| Interest Coverage | Declining |
The Concern: Inghams carries approximately AUD 1.49 billion in debt. For a company with a market capitalization of just AUD 730 million, this represents substantial leverage.
Why Debt Matters:
- Interest expense eats into already thin margins
- Covenant risk – if earnings fall further, the company may breach debt covenants
- Refinancing risk – in a higher interest rate environment, rolling over debt becomes more expensive
Key Risk: High debt + thin margins + falling earnings = elevated financial risk. This combination is typical of value traps.
Valuation: Is ING Cheap or Cheap for a Reason?
Key Valuation Metrics
| Metric | Value |
|---|---|
| P/E Ratio | ~13x |
| Forward P/E | ~10x |
| Price-to-Book (P/B) | Below 1.0 |
| EV/EBITDA | Elevated due to debt |
On a P/E basis, Inghams trades at approximately 13 times trailing earnings and 10 times forward estimates. This is not objectively expensive, but it is also not deep-value territory for a company with declining earnings.
Valuation Context
- Compared to consumer staples peers: Inghams trades at a discount, reflecting its operational challenges
- Compared to history: The stock is near multi-year lows, suggesting the market has already priced in significant downside
- Value trap warning: Cheap valuation alone does not make a stock a bargain. If earnings continue falling, today’s “cheap” price may remain flat or decline further
Investor Wisdom: “Price is what you pay. Value is what you get.” The market may be correctly pricing in a deteriorating earnings outlook.
Market Sentiment: What Are Investors Saying?
Bullish Arguments (Why ING Could Rise)
1. Defensive Industry
Food demand is non-discretionary. Even in a recession, people buy chicken. This provides a base level of stability.
2. High Dividend Yield
At 9.5%, the yield is among the highest on the ASX. For income-focused portfolios, this is difficult to ignore.
3. Undervalued Price
Trading near 52-week lows, the stock may be oversold. A re-rating could occur if sentiment improves.
4. Strong Cash Flow
Free cash flow of AUD 170 million provides a buffer. The dividend is currently covered by cash, even if earnings are weak.
Bearish Arguments (Why ING Could Fall Further)
1. Declining Earnings
A 37% drop in net income is a material deterioration. Until earnings stabilize, the stock is vulnerable.
2. Thin Margins
1.79% profit margins leave no room for error. Any cost shock could push the company into losses.
3. High Debt
AUD 1.49 billion in debt on a AUD 730 million market cap creates financial risk. In a rising interest rate environment, interest costs rise.
4. Dividend Risk
A 79% payout ratio combined with falling earnings suggests a dividend cut is possible. If the market prices in a cut, the stock could fall further.
Real Investor Views (Summary from Discussions)
“It’s cheap for a reason… lack of consistent income.”
“Still profitable… reasonable dividend yield.”
“High debt and thin margins—classic value trap.”
“Cash flow supports the dividend for now, but how long?”
Takeaway: Sentiment is divided. Value-oriented investors see opportunity. Income-focused investors chase the yield. Risk-aware investors worry about debt and earnings sustainability.
Bull Case vs. Bear Case: Side-by-Side
| Factor | Bull Case | Bear Case |
|---|---|---|
| Industry | Defensive staples; consistent demand | Competition from other proteins; pricing pressure |
| Dividend | 9.5% yield attracts income investors | High payout ratio; declining trend suggests cut risk |
| Valuation | Cheap on P/E; trading near lows | Cheap for a reason—earnings are falling |
| Cash Flow | Strong free cash flow supports dividend | Cash flow may decline if margins compress further |
| Debt | Manageable with current cash flow | AUD 1.49B debt creates leverage risk |
| Earnings | Could stabilize with cost controls | Down 37%—trend is negative |
Who Should Buy Inghams Group Limited?
Income Investors
- Attraction: 9.5% dividend yield
- Risk: High probability of dividend cut; declining payout trend
- Verdict: Only suitable if you accept the risk of reduced income
Value Investors
- Attraction: Cheap valuation; potential turnaround
- Risk: Structural issues (debt, margins) may not resolve quickly
- Verdict: Turnaround play, not a deep-value bargain
Growth Investors
- Attraction: Minimal
- Risk: Revenue stagnation; no growth catalyst
- Verdict: Avoid—this is not a growth story
Conservative Investors
- Attraction: None
- Risk: High debt, thin margins, earnings decline
- Verdict: Avoid entirely. This does not meet conservative criteria.
Future Outlook: What Needs to Happen for a Turnaround?
Catalysts for Recovery
- Cost Control
Feed grain costs (primarily wheat and corn) are a major input. Any sustained decline in grain prices would directly benefit margins. - Margin Stabilization
If Inghams can expand margins through operational efficiency or selective pricing, profitability could recover. - Debt Reduction
Management has indicated a focus on deleveraging. Any meaningful debt paydown would reduce financial risk and improve covenant headroom. - Stable Retail Contracts
Long-term contracts with Woolworths and Coles provide revenue visibility. Maintaining these relationships is critical. - Food Service Recovery
As the food service channel recovers from post-pandemic disruptions, volume could improve.
Risks to the Outlook
- Continued cost inflation without ability to pass through prices
- Competitor pressure from alternative proteins and other poultry producers
- Interest rate environment increasing debt servicing costs
- Consumer weakness affecting volume in discretionary channels
Final Verdict: High Yield or Value Trap?
Inghams Group Limited is a classic high-yield, high-risk stock.
Summary Table
| Aspect | Assessment |
|---|---|
| Dividend Appeal | High yield, but sustainability is questionable |
| Financial Health | Positive cash flow offset by high debt and thin margins |
| Valuation | Cheap, but may be cheap for a reason |
| Risk Level | Above-average |
| Best Suited For | Turnaround investors willing to accept dividend risk |
| Not Suited For | Conservative income investors seeking reliable payouts |
The Core Question
Is this a value trap or a turnaround opportunity?
The answer depends entirely on whether management can stabilize earnings and reduce debt while maintaining the dividend.
- If earnings recover and margins expand → the stock could re-rate higher, and the dividend may hold
- If earnings continue falling → the dividend will likely be cut, and the stock could fall further
Final Thought
Inghams is not a “safe dividend stock.” It is a turnaround play disguised as an income investment. Investors attracted by the 9.5% yield must be willing to accept that:
- The dividend may be cut
- The share price may remain depressed or fall further
- Recovery, if it comes, will take time
For investors who believe management can execute a turnaround, Inghams offers an asymmetric risk-reward profile. For those seeking reliable passive income, there are safer alternatives with lower yields but greater predictability.
Frequently Asked Questions
Is Inghams Group Limited a buy, hold, or sell?
That depends on your investment objectives. For income investors seeking stability, it is a hold or reduce. For contrarian value investors willing to accept risk, it is a speculative buy at current levels with a long-term horizon.
Why is the Inghams share price falling?
The share price has fallen due to declining earnings, thin margins, high debt levels, and market concerns about dividend sustainability.
Is the Inghams dividend safe?
The dividend is not entirely safe. A 79% payout ratio combined with falling earnings suggests a cut is possible, particularly if cash flow weakens.
What is the target price for ING stock?
Analyst targets vary, but most are in the AUD 2.00–2.50 range. The stock’s direction will be determined by earnings and margin trends.

