

WTI Crude Oil (USOIL) Analysis: Bearish Breakdown Accelerates as Geopolitical Premium Evaporates
WTI Crude Oil (USOIL) Analysis Bearish Breakdown
WTI crude oil trades at $73.64 as the US-Iran peace accord collapses the geopolitical risk premium. The symmetrical triangle has failed, opening the door toward $67.49. Full technical analysis.
Introduction: The Geopolitical Premium Has Evaporated
WTI Crude Oil (USOIL) is trading at **$73.64**, down **-0.53%** on the day after reaching a high of $74.05 and a low of $73.42. The commodity has experienced a violent breakdown from its previous consolidation ranges, shedding the geopolitical risk premium that had insulated energy futures throughout the spring .
The primary catalyst is the US-Iran peace accord signed in Islamabad, mediated by Pakistani Prime Minister Shehbaz Sharif. The landmark Memorandum of Understanding (MOU) has entered into force with immediate effect, bringing an end to the active conflict. As Washington begins dismantling its naval blockade and Iran prepares to reopen the Strait of Hormuz, the crisis premium that has been holding up the energy complex has completely melted away .
Current Price Snapshot
| Metric | Value |
|---|---|
| Current Price (USOIL) | $73.64 |
| Daily High | $74.05 |
| Daily Low | $73.42 |
| Daily Change | -0.39 (-0.53%) |
| Key Support | $72.01 / $66.49 / $59.93 |
| Key Resistance | $74.05 / $77.88 / $80.00 |
Source: TradingView / Capital.com
Technical Analysis: Key Levels to Watch
Current Price Action
WTI is trading near the bottom of its recent range, consolidating just below the $74.00 level. The chart shows a clear breakdown from previous consolidation zones near $80-85, with price now testing critical support levels.
Support Levels
| Support Level | Significance |
|---|---|
| $73.42 | Today’s low – immediate support |
| $72.01 | Horizontal zone – last line of defence for bulls |
| $66.49 | Recent swing low – strong support zone |
| $59.93 | Deep value floor – major support |
| $55.00 | Psychological level – long-term trend support |
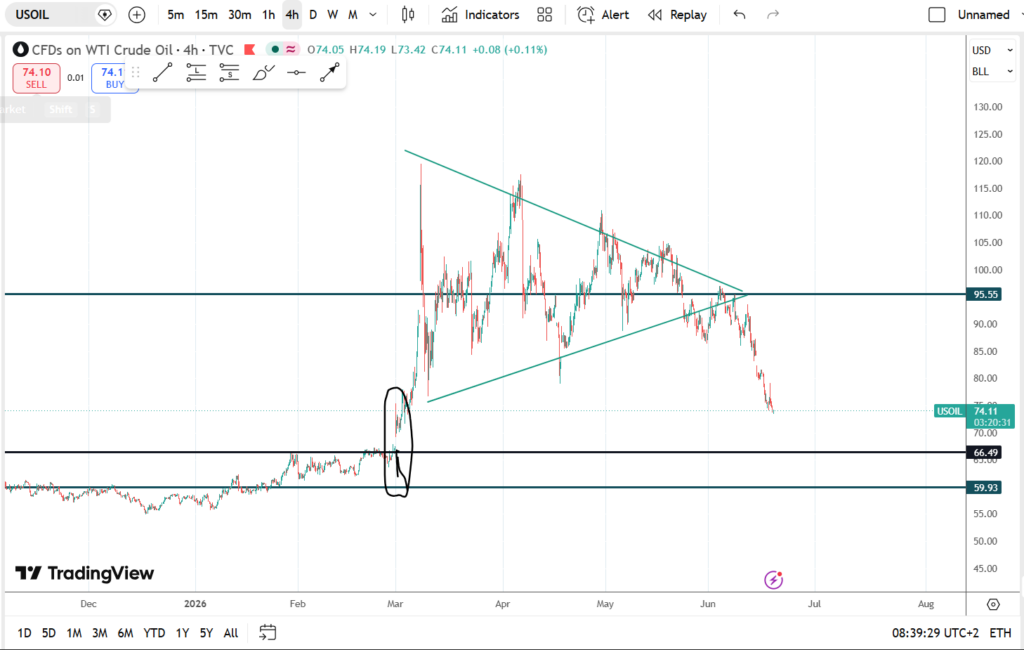
The chart reveals a failed triple-bottom breakout, with WTI completely erasing and reversing its entire spring rally from April support above the $80.00 region . The $72.01 horizontal zone serves as the absolute immediate line of defence for bulls. If daily candles continue to print shallow rebounds and fail to defend this baseline, a clean breakdown below $72.01 will open a direct downside highway toward $67.49 and $63.66 .
Resistance Levels
| Resistance Level | Significance |
|---|---|
| $74.05 | Today’s high – immediate resistance |
| $77.88 | Structural resistance shelf |
| $80.00 | Psychological barrier |
| $81.97 | Previous multi-week demand zone – now resistance |
| $88.00 | Former support – now major resistance |
The previous multi-week demand shelf near the $81.97 zone has been entirely taken over by institutional sellers, transforming it into a vital overhead resistance ceiling .
Descending Channel Framework
The daily price action remains strictly governed by the upper and lower boundaries of a heavy descending channel that has mapped lower highs since May . Price is currently testing the lower boundary of this channel, with:
- Upper channel boundary: ~$78-80
- Lower channel boundary: ~$72-73
RSI and Momentum
The daily RSI 14 has officially plunged down to 29, entering deep oversold territory . While this alerts swing traders to growing short-term exhaustion risk, it does not stop the broader downward channel velocity. In strongly trending markets, RSI can remain oversold for extended periods.
Moving Averages
Highlighting the severity of the structural markdown, the down-trending 50-day Moving Average ($92.86) is currently trading miles above the actual spot price . This indicates an extreme level of bearish momentum.
Fundamental Drivers: Why Oil Is Crashing
1. US-Iran Peace Accord – The Game Changer
The defining fundamental shockwave forcing oil lower is the concrete materialisation of the US-Iran peace accord .
- The signed MOU establishes clear safe-passage routing mechanisms
- More than 500 stranded cargo and tanker vessels are preparing to clear the Strait of Hormuz
- Iran will reopen the Strait of Hormuz immediately
- The US is dismantling its naval blockade
The IEA warning: The International Energy Agency warns that if the agreement is fully executed, global oil supply will outpace demand by a substantial 5.05 million barrels per day (bpd) next year .
2. Record US Production
Heavily compounding the bearish landscape is the absolute lack of any domestic supply constraints inside the United States. High-volume output from key US shale basins continue to print at near-record heights, ensuring that global physical asset inventories remain highly liquid even as sanctioned Iranian barrels prepare to hit international waters more freely .
3. Strong US Dollar and High Borrowing Costs
A firm US dollar and high borrowing costs under Fed Chair Kevin Warsh are dampening overall demand expansion . This creates a headwind for oil prices as global economic growth slows.
4. S&P Global’s Revised Price Assumptions
S&P Global Ratings recently revised its oil price assumptions significantly downward :
| Period | New WTI Assumption | Old WTI Assumption | Change |
|---|---|---|---|
| Remaining 2026 | $105/bbl | $95/bbl | ▲ +$10 |
| 2027 | $75/bbl | $70/bbl | ▲ +$5 |
| 2028+ | $60/bbl | $60/bbl | No change |
While S&P Global’s assumptions are still above current spot prices, the revisions reflect a more prolonged disruption than previously anticipated. However, the current market price of $73.64 suggests traders are looking past even these elevated assumptions.
Trading Scenarios for WTI Crude Oil
Bearish Scenario (Primary)
Conditions for a short position:
- Price breaks and closes below $74.00
- Follow-through below $72.01
| Entry | Stop Loss | Target 1 | Target 2 |
|---|---|---|---|
| Below $74.00 | Above $77.88 | $67.49 | $63.66 |
Catalyst: Confirmation of Strait of Hormuz reopening and OPEC+ production increases
Bullish Scenario (Counter-trend)
Conditions for a long position:
- Price holds above $72.01
- Break above $74.05 with strong volume
| Entry | Stop Loss | Target 1 | Target 2 |
|---|---|---|---|
| Above $74.05 | Below $72.00 | $77.88 | $81.97 |
Catalyst: OPEC+ production cuts or renewed geopolitical tensions
Neutral/Range-Bound Strategy
While oil consolidates between $73.42 and $74.05, a tight range trading approach may be appropriate:
- **Buy near $73.42** with stop below $72.00
- **Sell near $74.05** with stop above $75.00
Key Technical Takeaways
| Indicator | Signal |
|---|---|
| Price action | Bearish breakdown from consolidation |
| Trend | Descending channel established |
| Support | $72.01 (critical) |
| Resistance | $77.88 (near-term), $81.97 (major) |
| RSI (14) | 29 – deep oversold |
| 50-day MA | $92.86 – far above spot price |
| Volume | High on down days – distribution confirmed |
| Structure | Failed triple-bottom breakout |
What South African Investors Need to Know
Impact on South African Economy
| Factor | Effect |
|---|---|
| Fuel prices | Lower oil prices should translate to lower petrol/diesel prices |
| Rand exchange rate | Oil price weakness tends to weaken commodity-linked currencies |
| Inflation | Lower fuel costs reduce inflationary pressure |
| Interest rates | Lower inflation reduces pressure on SARB to hike rates |
Trading Considerations for SA Investors
- USOIL is available on international trading platforms
- SA investors can access via CFDs on platforms like Capital.com or through international brokerage accounts
- Exchange control: Use your R1 million single discretionary allowance for offshore transfers
- Currency risk: USD/ZAR movements will affect returns for SA-based investors
Practical Outlook for South African Consumers
If the current oil price trend continues, South African motorists could expect:
- Lower petrol and diesel prices at the next fuel price review
- Reduced transport costs feeding into lower food prices eventually
- Less pressure on the SARB to hike interest rates
Frequently Asked Questions
What is the WTI crude oil price today?
WTI crude oil (USOIL) is trading at **$73.64**, down -0.53% on the day with a high of $74.05 and a low of $73.42.
Why is the oil price crashing?
The primary driver is the US-Iran peace accord, which is reopening the Strait of Hormuz and bringing more than 5 million bpd of oil back to global markets .
What is the key support level for WTI?
The critical support level is **$72.01**. A break below this opens the door toward $67.49 and $63.66 .
What is the key resistance level for WTI?
Immediate resistance is $77.88**, followed by the former demand zone at **$81.97 .
Is WTI oversold?
Yes. The daily RSI 14 has dropped to 29, indicating deep oversold conditions .
How does the US-Iran peace deal affect oil?
The accord restores roughly one-fifth of global oil shipments that were disrupted by the closure of the Strait of Hormuz, eliminating the geopolitical risk premium that had supported higher prices .
What is the 50-day moving average for WTI?
The 50-day moving average is currently at $92.86 – far above the current spot price, reflecting the severity of the recent sell-off .
What are the long-term price forecasts?
S&P Global Ratings forecasts WTI at **$105/bbl for the remainder of 2026**, $75/bbl for 2027, and $60/bbl for 2028 and beyond .
Final Word
WTI crude oil has experienced a dramatic breakdown from its spring consolidation ranges, driven by the historic US-Iran peace accord that is reopening the Strait of Hormuz and flooding global markets with supply. The geopolitical risk premium that held oil above $80 for months has completely evaporated.
The technical picture is firmly bearish, with price trading in a descending channel below the 50-day moving average. While the RSI is deeply oversold at 29, this does not guarantee a reversal – in strong trends, oversold can remain oversold for extended periods.
For South African consumers, lower oil prices represent good news at the pumps and for inflation. For traders, WTI offers significant opportunities – but the current trend demands disciplined risk management.
Key takeaways:
- Current price: $73.64 (-0.53%)
- Key support: $72.01 / $67.49 / $63.66
- Key resistance: $74.05 / $77.88 / $81.97
- Primary driver: US-Iran peace accord ending the crisis premium
- SA impact: Lower fuel prices expected in coming months
- Trend: Bearish breakdown from consolidation
Disclaimer: This article is for educational and informational purposes only and does not constitute financial advice. Trading crude oil and other financial instruments carries a high level of risk. Always conduct your own research or consult a licensed financial advisor before making investment decisions.

